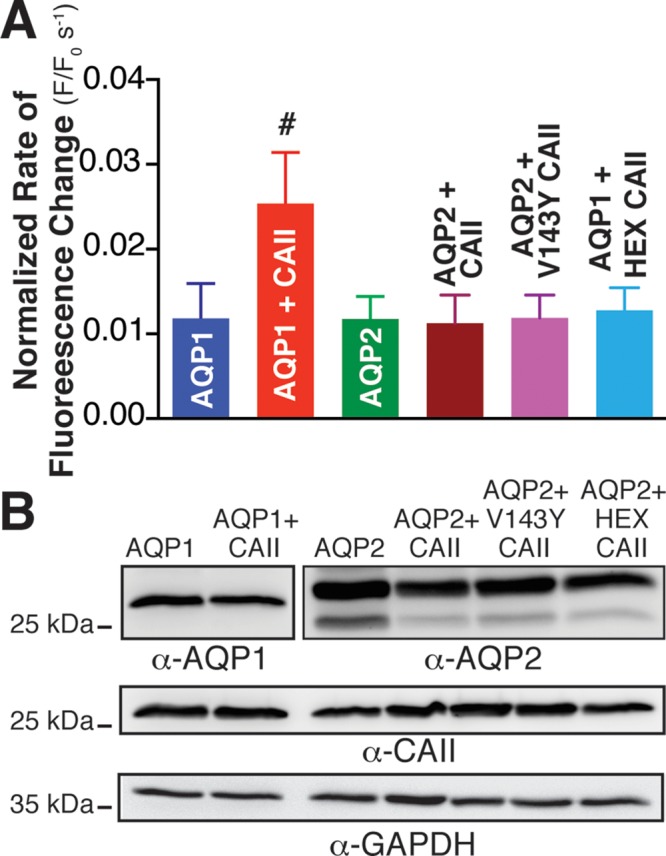
FIGURE 5:

CAII expression does not increase water flux through AQP2 expressed in HEK293 cells. Aquaporin-mediated (AQP1 and AQP2) water transport activity was measured by confocal fluorescence microscopy of transfected HEK293 cells as per Figure 4. (A) Rate of fluorescence change corrected for activity of vector-transfected cells and normalized to AQP1 or AQP2 cell surface expression. Cell surface expression was determined by biotinylation and is presented in Supplemental Figure S7. Number sign (#) represents a statistically significant difference (p < 0.05) compared with AQP1; n > 3 per condition. (B) Immunoblots demonstrating total cellular expression of AQP1, AQP2, CAII, and glyceraldehyde-3-phosphate dehydrogenase (GAPDH).
