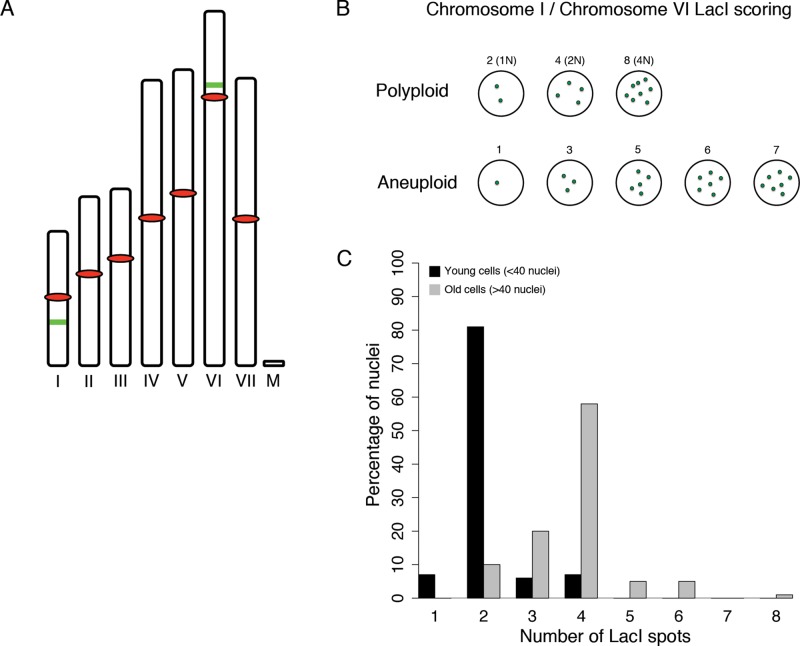
FIGURE 5:
Ashbya nuclei are predominantly polyploid. (A) Schematic of Ashbya chromosomes. All seven chromosomes and the mitochondrial DNA are shown to scale. Red ovals indicate centromeres, and green bars indicate the location of the 32lacO::Gen3 integration onto chromosomes I and VI. (B) Schematic of ChI 32lacO::Gen3/ChVI 32-lacO::Nat1 results. Nuclei with two, four, or eight resolvable LacI spots are polyploid. All other LacI spot counts would be evidence for aneuploidy. (C) Quantification of chromosome counts in ChI 32-lacO::Gen3/ChVI 32-lacO::Nat1 Ashbya nuclei. Black bars represent the distribution for young cells (<40 nuclei, N = 118), and gray bars represent the distribution for older cells (>40 nuclei, N = 253).

