FIGURE 7:

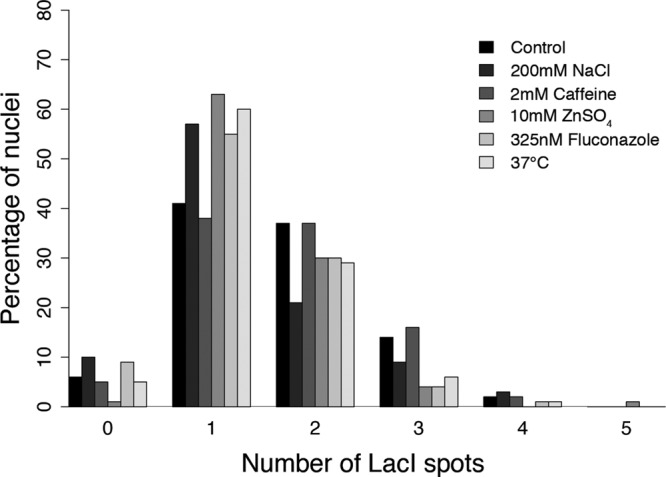
Chromosome number variation decreases in response to various cellular stresses. Quantification of chromosome I counts in Ashbya nuclei under normal growth and in the presence of various cellular stresses (>85 nuclei/condition).

Chromosome number variation decreases in response to various cellular stresses. Quantification of chromosome I counts in Ashbya nuclei under normal growth and in the presence of various cellular stresses (>85 nuclei/condition).