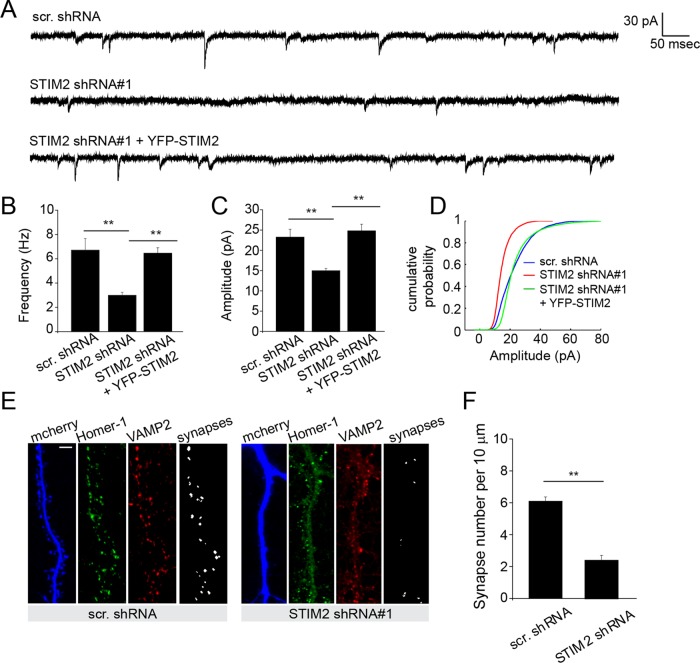
FIGURE 3:
STIM2 shapes functional synaptic inputs. (A–D) whole-cell patch-clamp recordings of hippocampal neurons (DIV 15–18) sparsely transfected with the indicated shRNA constructs. (A) Individual mEPSC traces of cells expressing the indicated shRNAs. STIM2 shRNA#1 was coexpressed with YFP-STIM2 for rescue experiments. (B–D) Quantification of mEPSC frequency and amplitude (Scr, 23.2 ± 2 pA, 6.7 ± 1.0 Hz, n = 11; STIM2 shRNA#1, 15.0 ± 0.6 pA, 2.9 ± 0.3 Hz, n = 9; STIM2 shRNA#1 + YFP-STIM2, 24.7 ± 1.6 pA, 6.4 ± 0.5 Hz, n = 11; **p < 0.01, ANOVA). (D) Cumulative distribution of mEPSC amplitude. (E) Synaptic density measured in control and STIM2-silenced hippocampal neurons (DIV 21) by costaining with presynaptic (VAMP2) and postsynaptic (Homer1) markers. Scale bar, 5 μm. Overlapping VAMP2/Homer1 puncta are detected and scored (F) by a MATLAB script (see Materials and Methods). Synaptic density per 10 μm: scr. shRNA, 6.1 ± 0.27, n = 15; STIM2 shRNA #1, 2.4 ± 0.3, n = 17; p < 0.01, t test.

