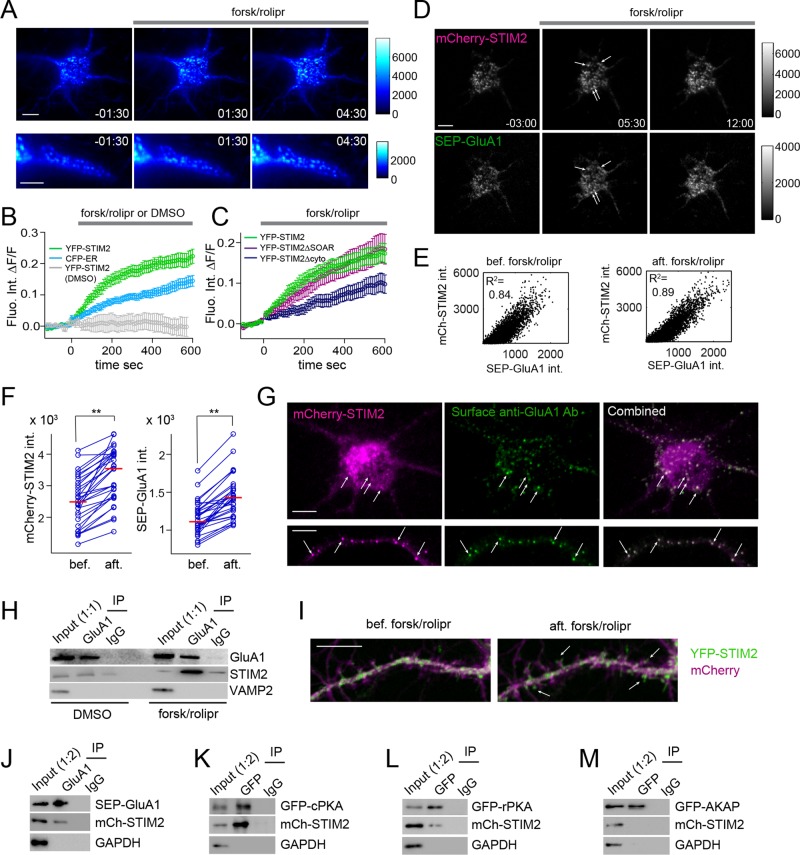
FIGURE 6:
cAMP-induced recruitment of STIM2 and GluA1 to ER-PM contacts. (A–C) TIRF imaging of hippocampal neurons (DIV 6–8) showing cAMP-induced redistribution of YFP-STIM2 to puncta near the PM in the soma (top; see Supplemental Movie S3) and in a proximal dendrite (bottom). (B) cAMP-induced changes in fluorescence intensity in the soma of neurons coexpressing YFP-STIM2 (green, n = 10) and CFP-ER (cyan, n = 10). The vehicle (DMSO) has no effect on YFP-STIM2 intensity (gray, n = 5). (C) Quantification of cAMP-dependent increase in fluorescence intensity in the cell soma for YFP-STIM2 (green, n = 13), ∆SOAR (purple, n = 9), and ∆cyto (dark blue, n = 16). (D–F) TIRF imaging of hippocampal neurons (DIV 6–8) electroporated with mCherry-STIM2 and SEP-GluA1, showing colocalization of mCherry-STIM2 and SEP-GluA1 in puncta both before and after forsk/rolipr addition (see Supplemental Movies S4 and S5). (E) Scatterplots of mCherry-STIM2 against SEP-GluA1 fluorescence intensity (each dot represents a single pixel within the neuron) before and 10 min after forsk/rolipr addition, showing extensive colocalization of mCherry-STIM2 and SEP-GluA1. (F) Pairwise analysis of fluorescence intensity in individual puncta (derived from three neurons) for mCherry-STIM2 and SEP-GluA1 before and 10 min after forsk/rolipr addition. Red bars indicate the median. **p < 0.01, paired t test. (G) TIRF imaging of fixed hippocampal neurons (DIV 7) coexpressing mCherry-STIM2 and GFP-GluA1, treated with forsk/rolipr for 30 min, and stained with an N-terminal GluA1 Ab (Alexa 633) in nonpermeabilizing conditions. Only the mCherry-STIM2 and the surface Ab staining are shown. Arrows point to puncta in the soma (top) and dendritic segment (bottom) that contain both mCherry-STIM2 and surface GluA1. (H) Co-IPs of cortical neurons (DIV 21) treated with DMSO (vehicle) or forsk/rolipr for 30 min with a GluA1 Ab or control IgGs. (I) Dual-color confocal imaging of hippocampal neurons (DIV 21) electroporated with YFP-STIM2 and mCherry, showing cAMP-induced redistribution of YFP-STIM2 (green) in dendritic spines labeled with mCherry (magenta). Snapshots are shown before and 30 min after forsk/rolipr addition. Arrows indicate spines with increased YFP-STIM2 intensity after cAMP elevation (see Supplemental Movie S6). (J–M) Co-IPs of HeLa cells coexpressing mCherry-STIM2 with SEP-GluA1 (J), GFP-cPKA (K), GFP-rPKA (L), and GFP-AKAP (M) treated with forsk/rolipr for 30 min. IPs were carried out with a GluA1 Ab (J), GFP Ab (K–M), or control IgGs. Scale bar, 5 µm.

