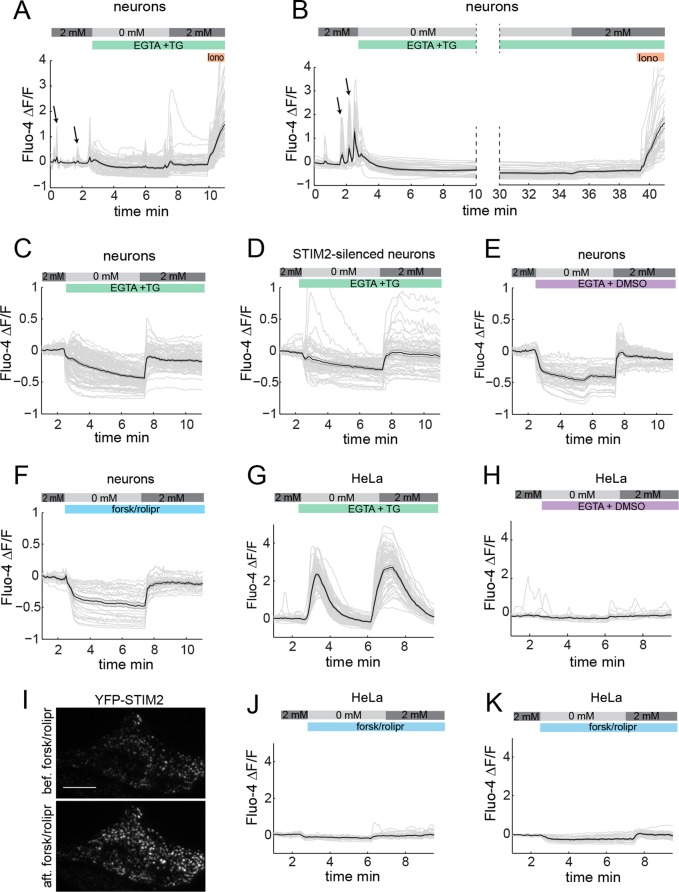
FIGURE 7:
cAMP-induced redistribution of STIM2 does not trigger SOCE. (A, B) SOCE measured in Fluo4-loaded hippocampal neurons (DIV 14) after thapsigargin (TG)-induced short (A) or long (B) store depletion, with a cocktail of inhibitors (1 μM TTX, 10 μM AP-5, 10 μM CNQX, and 50 μM nifedipine) added during Ca2+ addback. Note the small magnitude of the Ca2+ influx upon Ca2+ readdition compared with that of spontaneous Ca2+ transients (arrows) or ionomycin (Iono)-induced Ca2+ influx. (C–F) SOCE measured in hippocampal neurons (DIV 14–15) with the inhibitor cocktail present throughout the time series and displayed at a different y-axis scale. (C, D) SOCE response in the presence of thapsigargin measured in control (C) or STIM2-silenced (D) neurons. (E, F) Ca2+ influx upon Ca2+ readdition in the absence of thapsigargin (E) or the presence of forsk/rolipr (F). (G, H) SOCE measured in Fluo4-loaded HeLa cells treated with thapsigargin (G) or DMSO (H). (I) cAMP-induced translocation of STIM2 to puncta in HeLa cells imaged by TIRF microscopy. Snapshots are shown before and 15 min after forsk/rolipr addition. Scale bar, 20 μm. (J, K) Forsk/rolipr does not trigger a SOCE response in HeLa cells expressing endogenous STIM2 (J) or mCherry-STIM2 (K). Ca2+ traces from individual cells are shown in light gray. The average trace is shown in black. Shaded error bar, SEM. The extracellular Ca2+ concentration (0 or 2 mM) is indicated on top of these traces. SOCE measurements in HeLa cells were also done in the presence of 1 μM TTX, 10 μM AP-5, 10 μM CNQX, and 50 μM nifedipine.

