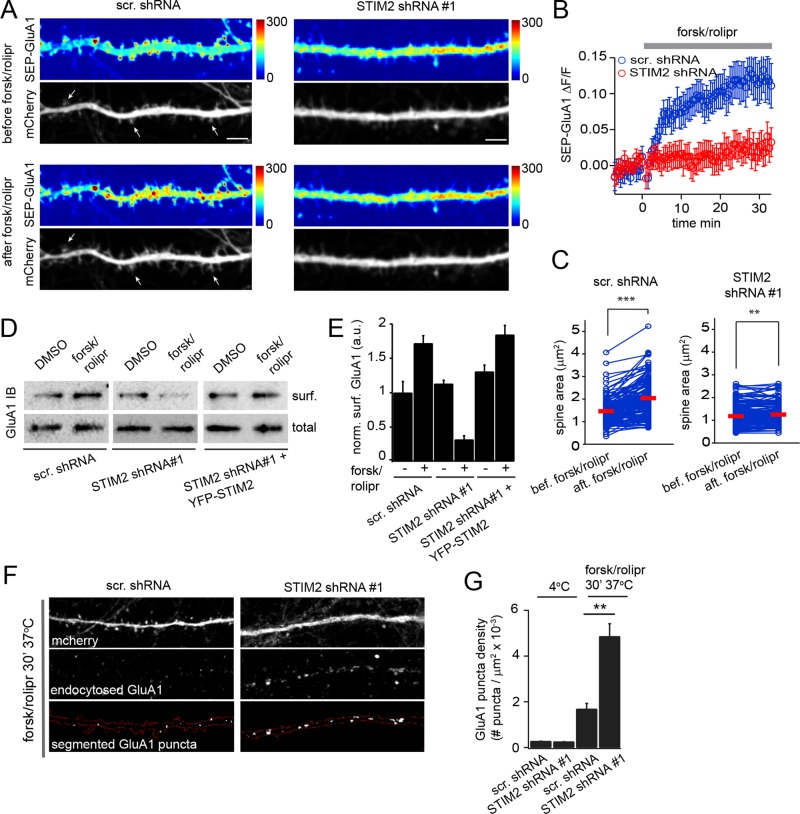
FIGURE 8:
STIM2 mediates cAMP-dependent surface delivery of GluA1. (A–C) Hippocampal neurons (DIV 17–19) coelectroporated with scramble or STIM2 shRNA#1 (mCherry) and SEP-GluA1 were imaged by dual-color confocal microscopy during stimulation with forsk/rolipr. (A) SEP-GluA1 and mCherry fluorescence shown before and 30 min after forsk/rolipr treatment in control (left) and STIM2-silenced cells (right). SEP-GluA1 intensity is color coded. The arrows show examples of spines that have undergone forsk/rolipr-induced enlargement. Scale bar, 5 μm. See Supplemental Movies S7–S10 (B) Average change in SEP-GluA1 intensity in control and STIM2-silenced cells measured in 16 dendritic segments from four independent experiments for each condition. Error bars, SEM. (C) Pairwise analysis of individual spine surface area before and after forsk/rolipr in control and STIM2-silenced neurons. Red bars indicate the mean. ***p < 0.001, **p < 0.01, paired t tests. (D) Streptavidin pull downs from control, STIM2-silenced, or STIM2-silenced cells rescued with YFP-STIM2 that were surface biotinylated after DMSO (vehicle) or forsk/rolipr treatment. (E) Densitometry analysis of surface GluA1 for conditions shown in D. Average and SD are shown for three independent experiments. (F, G) GluA1 endocytosis assay. Surface GluA1 in control or STIM2-silenced neurons (DIV 20) was bound to an Ab at 4°C and the Ab–receptor complex allowed to internalize for 30 min at 37°C in the presence of forsk/rolipr. Surface Abs were stripped after incubation at 4°C (G) or 37°C (F, G). Endocytic GluA1 puncta located in mCherry-expressing dendrites were then segmented and scored using a MATLAB-based script. Scale bar, 10 μm. (G) Average density of GluA1 endocytic puncta. More than 50 dendritic segments from three independent experiments were quantified for each condition. p < 0.01, t test. See also Supplemental Movies S6–S9.

