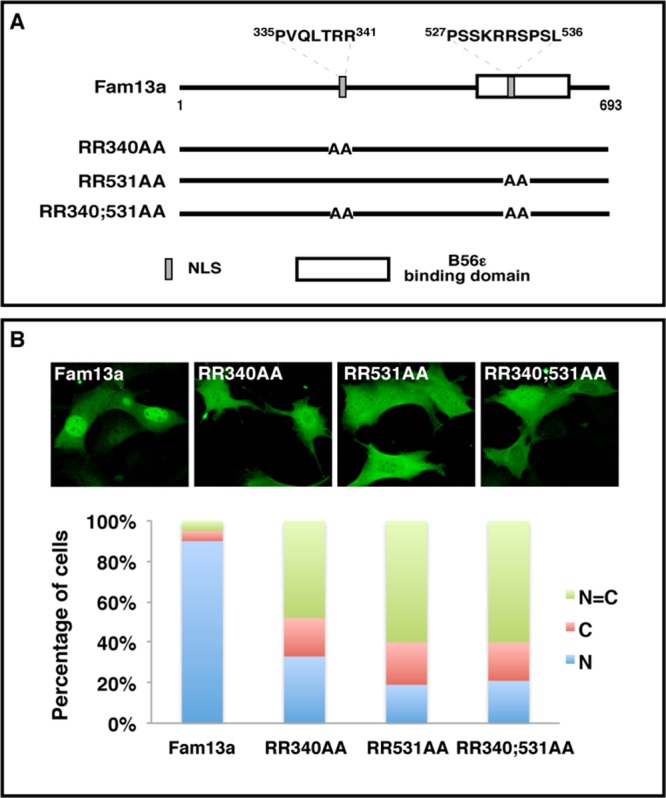
FIGURE 2:

Identification of NLSs in Fam13a. (A) Schematic diagram of wild-type Fam13a and NLS mutants (RR340AA, RR531AA, and RR340;531AA). (B) Representative immunofluorescence images showing the nuclear localization of wild-type Fam13a and mislocalization of NLS mutants in NIH3T3 cells. Bar graphs show percentage of cells that exhibit nuclear, cytoplasmic, or homogeneous subcellular distribution. R, arginine; A, alanine.
