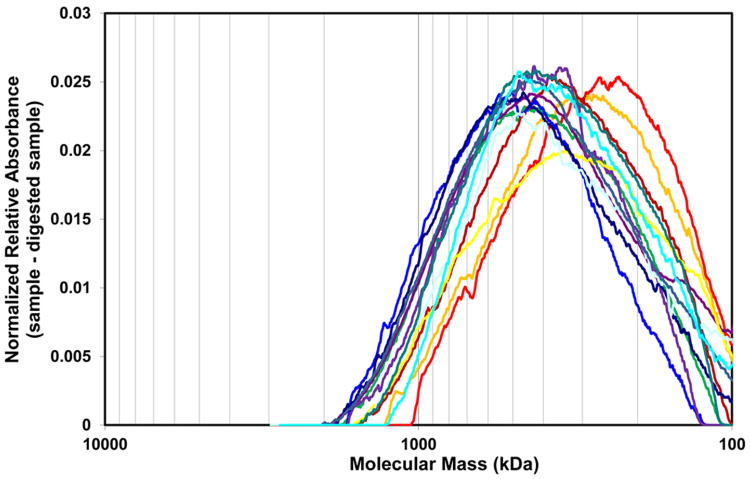
Fig 8.
Densitometric analysis of electrophoretic separation of 0.800 M elutions of thirteen milk HA samples by IEX. The M distributions were obtained by subtracting the digested sample profiles from the corresponding undigested ones. The average M and range of M for each sample was obtained from these profiles. The M distributions are highly similar among thirteen independent milk samples.

