
FIGURE 2.
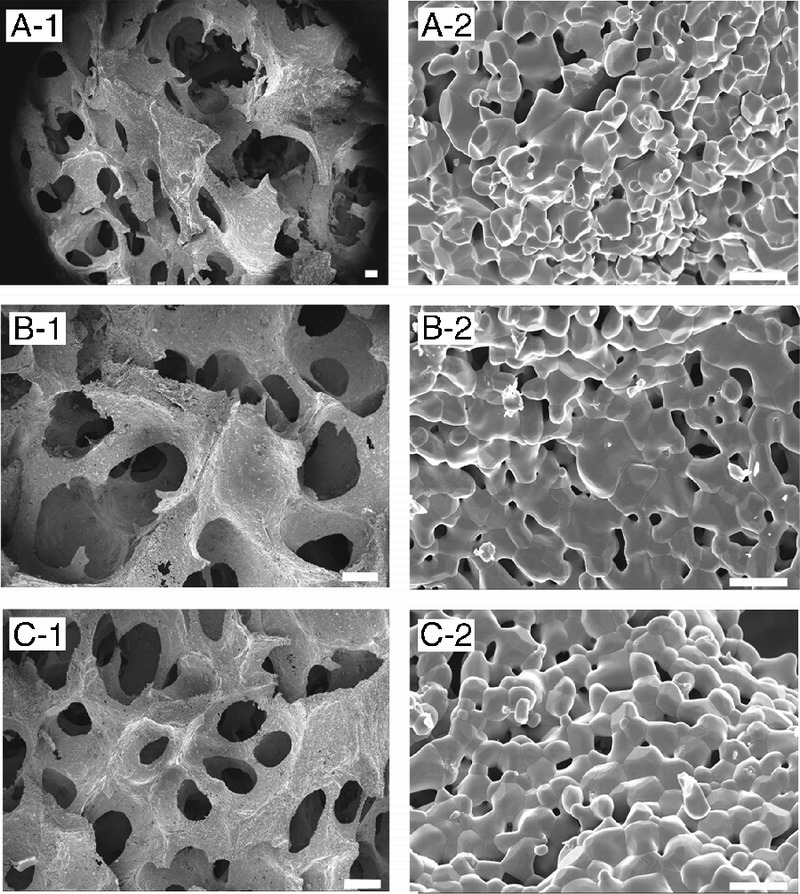
The SEM examination of the 3 kinds of scaffolds. A to C show images of GP, LP, and SP, respectively. A-1 shows the junction between large and small pore regions. A-2, B-2, and C-2 show high-magnification scans of their respective surfaces. Scale bars = 200 μm for A-1, B-1, and C-1; scale bars = 10 μm for A-2, B-2, and C-2.