
FIGURE 9.
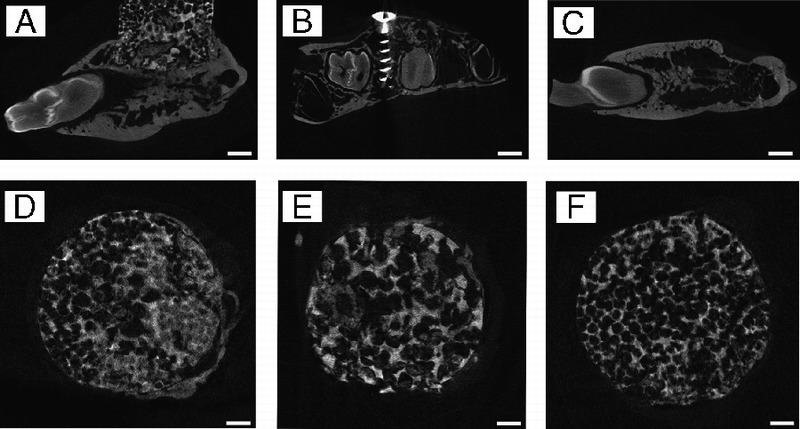
The μCT sagittal images of samples of augmented mandibles. A is the experimental group, B is the positive control group, and C is the negative control group. D to F are the μCT coronal images of the samples of the 3 experimental groups. D shows the GP group, E shows the LP group, and F shows the SP group. Scale bars = 1000 μm.