
Fig 4.
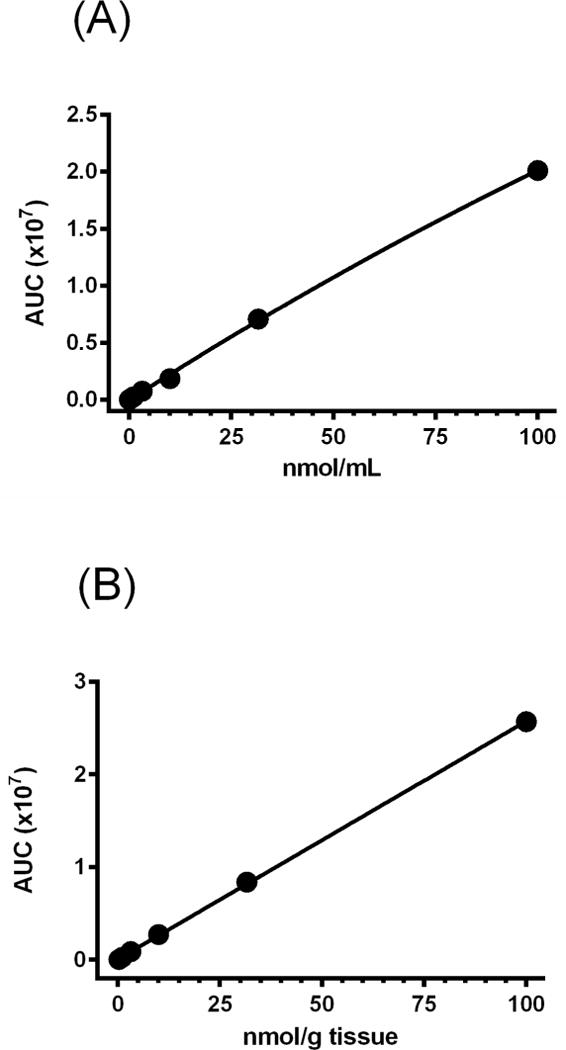
(A) Standard curve of DON in plasma after derivatization with acidified butanol and LC-MS analysis – DON was spiked into untreated mouse plasma to generate standards at various concentrations. DON derivatization was carried out with n-butanol containing 3N HCl. After centrifugation to separate denatured proteins, supernatant was incubated at 60°C for 30 minutes. Derivatized DON was detected by LC-MS. Standards in the 30 nM to 100 μM range were used to generate a standard curve. (B) Standard curve of DON in brain after derivatization with acidified butanol and LC-MS analysis – DON was spiked into untreated mouse brain to generate standards at various concentrations. DON derivatization was carried out with n-butanol containing 3N HCl. After centrifugation to separate denatured proteins, supernatant was incubated at 60°C for 30 minutes. Derivatized DON was detected by LC-MS. Standards in the 30 nM to 100 μM range were used to generate a standard curve.