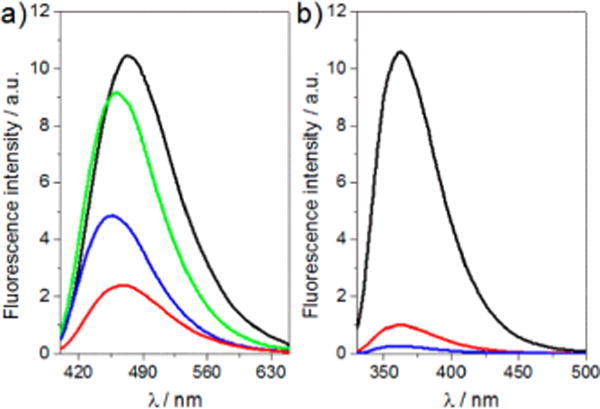
Figure 3.

Emission spectra of (a) dthG- and (b) d2Ap-labeled (−)PBS sequences. Emission spectra of (a) dthG free nucleoside (black), dthG7(−)PBS (red), dthG7(−)/(+)PBS (blue), and dthG7(−)/T12-(+)PBS (green); (b) d2Ap free nucleoside (black), d2Ap7(−)PBS (red), and d2Ap7(−)/T12(+)PBS (blue). Excitation was at 380 nm for dthG and 315 nm for d2Ap. Nucleoside and ODN concentration was 6 μM for dthG and 4 μM for d2Ap in 25 mM TRIS-HCl buffer (pH 7.5), 30 mM NaCl, and 0.2 mM MgCl2.
