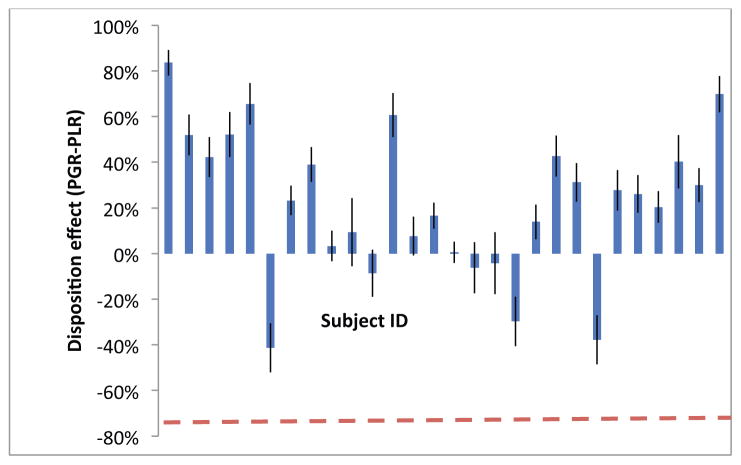
Figure 4. Measures of the disposition effect (PGR-PLR) for each subject.
Standard error bars are computed as in Odean (1998) and the dotted line indicates the optimal level of the disposition effect that an expected value trader would exhibit, namely −0.76. All subjects exhibit a disposition effect greater than the optimal level and a majority of subjects have a disposition effect that is significantly positive. The figure indicates that there is significant heterogeneity in the size of the disposition effect across subjects (SD: 0.32).

