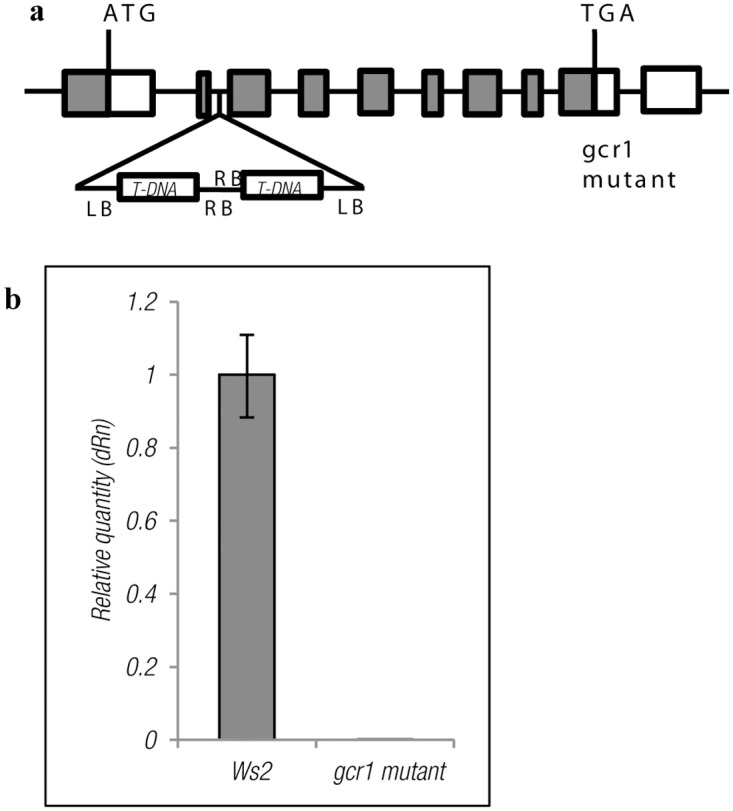
Fig 1. (a) T-DNA insertion site/orientation in the mutated gene of GCR1.

The exons are represented as boxes and the introns are represented as lines. LB and RB represent the left and right border respectively. (b) qPCR validation of the mutant. The real time RT-PCR was performed in triplicate using independent samples of total RNA and the values are represented as relative quantity ± SE.
