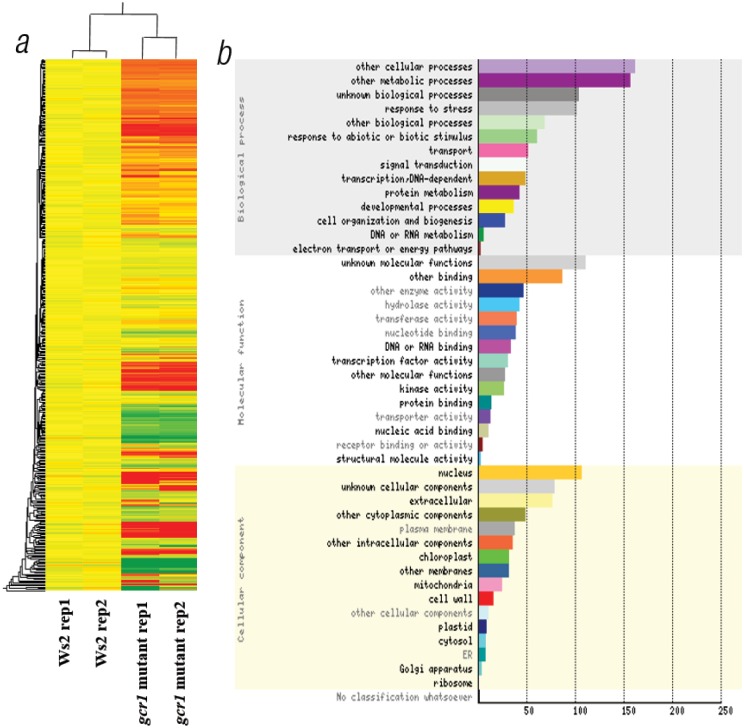
Fig 2. (a) Heat map of differentially expressed genes.
The background-subtracted microarray data was subjected to hierarchical clustering using Genespring software ver. 11.5 to generate the heatmap. Yellow represents the control data, while red and green represent up-regulation and down regulation respectively. (b) GO categorization of DEGs. The DEGs were categorized into GO classes using classification superviewer tool of Bioarray resource (www.bar.utoronto.ca)

