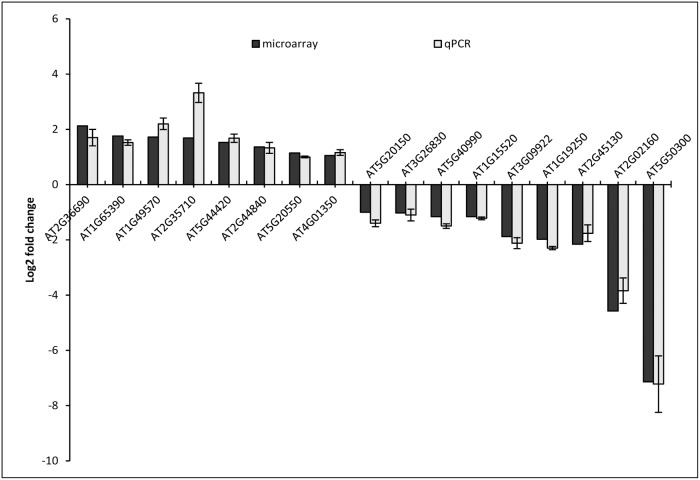
Fig 3. Validation and comparison of microarray results using qPCR for a few genes selected from each of the important biological processes.
The experiment was carried out using biological triplicates and the values are presented as log2FC ± SE. (AT2G36690–2-OG; AT1G65390—ATPP2-A5; AT1G49570—peroxidase family protein; AT2G35710—PGSIP7; AT5G44420—PDF1.2; AT2G44840—ERF13; AT5G20550–2-oxoglutarate; AT4G01350—Cysteine/Hisidine-rich C1 domain family protein; AT5G20150—SPX1; AT3G26830—PAD3; AT5G40990—GLIP1; AT1G15520—PDR12; AT3G09922—IPS1; AT1G19250—FMO1; AT2G45130—SPX3; AT2G02160—CCCH type zinc finger family protein; AT5G50300—AZG2.

