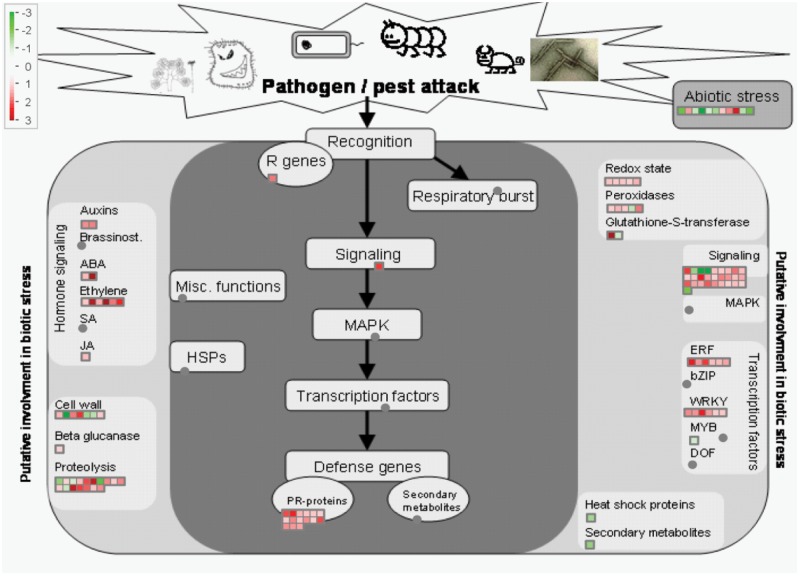
Fig 4. Mapman analysis of genes differentially regulated in gcr1 mutant.
Out of the total list of 350 DEGs, 119 mapped onto biotic stress response. The red dots represent the up-regulated genes, green dots represent the down-regulated genes and the grey dots represent the genes to which none of the DEGs were assigned. The level of differential regulation is according to the scale given.

