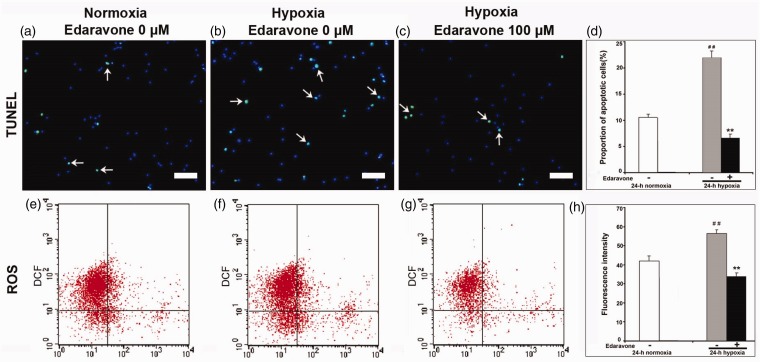
Figure 8.
Detection of NSPCs apoptosis and intracellular ROS in vitro. (a–c) Images of the cells double-labeled for TUNEL (green) and DAPI (blue). Decreased cell apoptosis was observed in the edaravone-treated cells. Arrows indicated BrdU/TUNEL-double-positive cells. Bar = 50 µm. (d) Quantification of cell apoptosis. (e–g) Endogenous ROS was measured by flow cytometry. (h) Quantification of DCF fluorescence. The experiment was repeated three times. **p < .01 compared with the untreated group. ##p < .01 compared with normoxia. TUNEL = terminal dUTP nick-end labeling; ROS = reactive oxygen species; DCF = 2,7-dichlorofluorescien.

