
Figure 5.
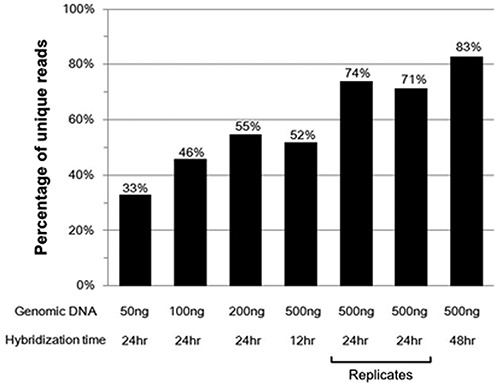
Relative quantity of circularized MIP products. The y-axis shows the ‘percentage of unique reads’, with unique reads defined as those having distinct barcodes and arm sequence combinations. Since the number of unique reads increases as total number of reads increases, in order to normalize it, we randomly selected 2 million reads for each condition, counted the number of unique reads and calculated the percentage of unique reads. As the amount of gDNA or hybridization time increased, more unique reads were detected, indicating that more circularized product was obtained. A 1:500 gDNA:probe ratio and 10x dNTPs were used for all conditions.