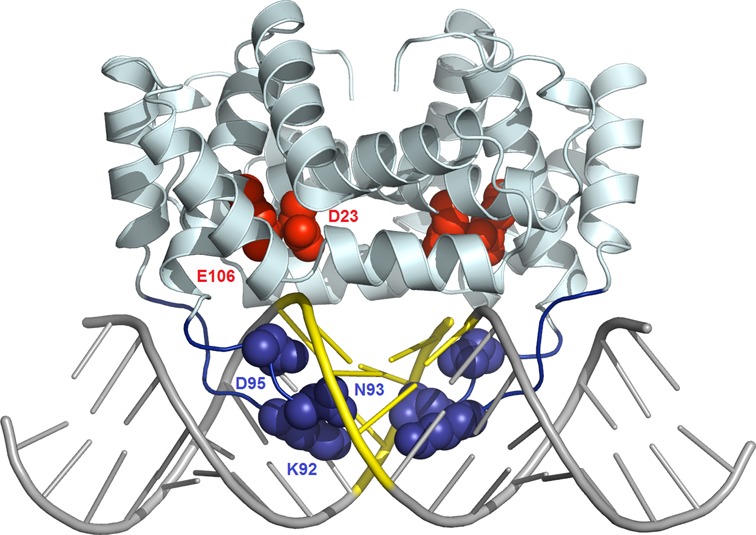
Figure 5.

Model of BsMiniIII–dsRNA complex structure. The experimentally determined BsMiniIII structure is shown as a pale cartoon, and the modeled loop α5b-α6 is shown in blue. The homology-modeled dsRNA 20 mer is shown as gray sticks, with the BsMiniIII target site ACCU/AGGU in yellow. The side chains of putative catalytic residues conserved between MiniIII and RNase III are shown as red CPK balls. The residues predicted to interact with the target RNA sequence are shown as blue CPK balls. The coordinates of the model are available from ftp://genesilico.pl/iamb/models/RNases/eRNase_BsMiniIII/
