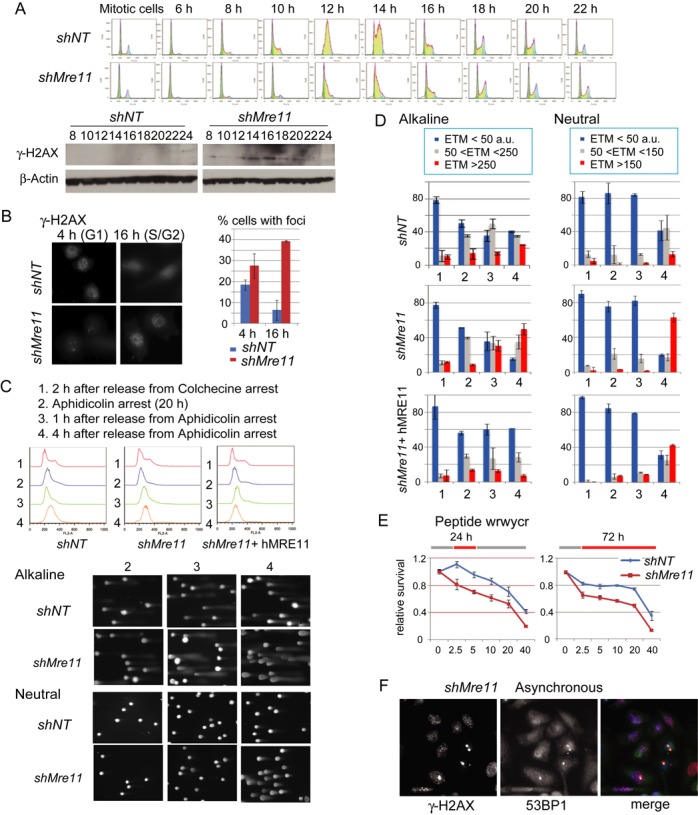
Figure 2.

(A) Increased γ-H2AX in S-phase in Mre11-KD cells. Top: cells were collected by mitotic shake-off, and cell cycle progression was monitored at indicated time points by FACS. Bottom: western blotting analyses for γ-H2AX of the same samples. (B) Cells with multiple γ-H2AX foci are increased during S-phase in Mre11-KD cells. γ-H2AX immunostaining (left) and the percentage of cells with γ-H2AX foci at 4 h (G1) and 16 h (G2) after release (right) are shown. (C) Single cell electrophoresis (Comet) analysis. Experimental conditions (top), FACS profiles for each condition and genotype (middle) and representative gel images from control and Mre11-KD cells (bottom) are shown. Note that, in alkaline conditions, tail moments increased at 2 h after release from aphidicolin arrest (condition 3), whereas in neutral conditions tail moments increased at 4 h after release (condition 4). (D) DNA breaks during replication in Mre11-KD cells. The degree of DNA damage is evaluated as a tail moment. For each genotype, results in alkali (left) and neutral conditions (right) are shown. The experimental conditions (1, 2, 3 and 4 in X-axis) are indicated in C. Y-axis represents the fractions of cells with the indicated tail moments. (E) Mre11-KD cells are hypersensitive to peptide WRWYCR that binds to the four-way DNA junctions. WRWYCR was added to the media 24 h after plating the cells. Left: relative cell survival after the 24-h treatment followed by the 48 h of recovery without WRWYCR; right: relative cell survival after 72 h treatment with WRWYCR. (F) Co-localization of large γ-H2AX foci and 53BP1 nuclear bodies in post-mitotic cells. Nuclei from asynchronous Mre11-KD cells were stained with anti- γ-H2AX and anti-53BP1 antibodies. Post-mitotic (G1 phase cells) can be distinguished by their small size and paired localization.
