Figure 2.

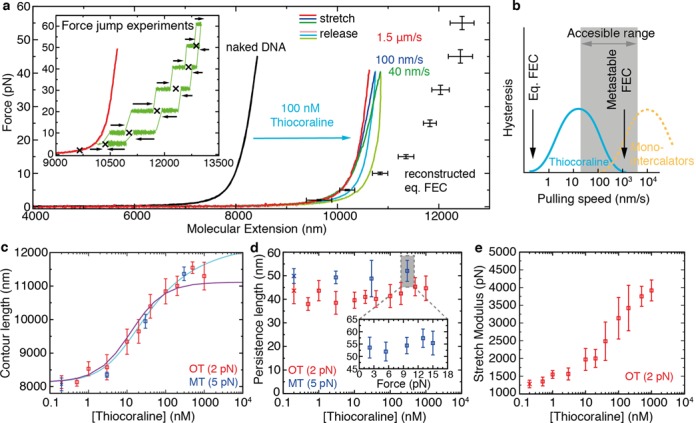
FECs of bis-intercalated DNA and elasticity measurements from metastable FECs. (a) DNA pulling curves before (black) and after flowing 100-nM Thiocoraline at varying pulling speeds: 1.5 μm/s (red), 100 nm/s (blue), 40 nm/s (green). Dark (light) colors correspond to the stretching (releasing) parts of the cycle. The equilibrium FEC (black points, mean ± SD, N ≥ 5) is recovered by performing force jump experiments. Inset: in force-jump experiments the relaxation of the molecular extension (green) is measured at constant force values starting from different initial conditions in bidirectional experiments (arrows). The equilibrium extension at each force (crosses) can then be inferred. A metastable FEC (1.5 μm/s) is shown in red as a reference. (b) Schematics of the hysteresis observed in FECs as a function of pulling speed. For the experimental conditions tested, Thiocoraline (cyan) shows an optimal range to measure metastable FECs, as compared to mono-intercalators (yellow) that reach equilibrium over shorter timescales. (c) Contour length (l0) of DNA as a function of [Thiocoraline] in optical (red squares) and magnetic tweezers (blue squares) experiments. The optical tweezers data are fitted to an MGVH binding isotherm (cyan; Equation. (3)) to obtain the equilibrium affinity and binding-site size at low force (Kd = 77 ± 13 nM, n = 3.84 ± 0.12 bp). The theoretical prediction by a three-state model (without free parameters) is shown in purple (see the ‘The kinetic off-rate (koff) reveals a binding intermediate’ section). (d) Persistence length (Lp) of DNA as a function of [Thiocoraline]. Lp remains independent of Thiocoraline concentration both in optical tweezers (red) and magnetic tweezers (blue) experiments. Inset: Lp remains also unaffected when the bound fraction is changed by equilibrating the molecule at a different force. (e) Stretch modulus (S) of DNA as a function of [Thiocoraline]. S monotonically increases with [Thiocoraline]. For panels (c)–(e) values are reported as mean ± SD (N ≥ 7 independent molecules), and are determined by fitting metastable FECs (v = 1.5–3 μm/s) to the extensible (optical tweezers) or inextensible (magnetic tweezers) WLC model. Reference values from experiments without Thiocoraline for each technique are shown at the lowest concentration (red and blue crosses).
