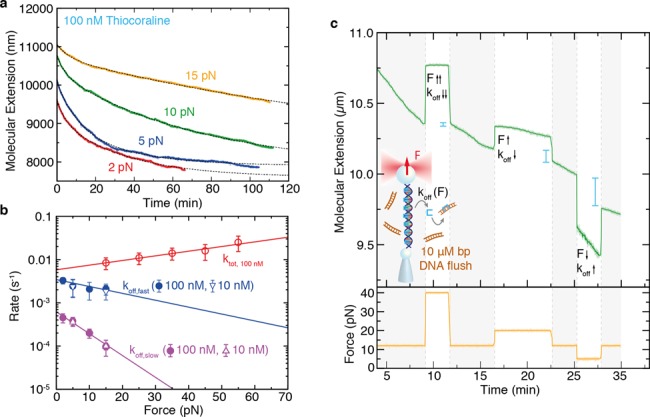
Figure 5.

Off-rate kinetics of bis-intercalation. (a) DNA extension as a function of time in wash-off experiments starting at 100-nM Thiocoraline at four different forces, and fit to a double-exponential function (dotted gray). (b) Force dependence of the macroscopic kinetic rates: fast off-rate (blue), slow off-rate (purple). In red, ktot from force-jump experiments is plotted as a reference. A fit to Equation (7) (solid lines) yields the macroscopic zero-force rates (koff, slow(0) = 6.2(7) · 10−4s−1, koff, fast(0) = 3.4(4) · 10−3s−1) and transition-state distances ( nm,
nm,  nm) for each process. Values are reported as mean ± SD, N ≥ 3. (c) Wash-off experiment in which different forces (yellow) are sequentially tested within the same kinetic trace. The molecular extension (green) is initially followed at a constant force of 12 pN. The slope of the molecular extension is proportional to the number of bis-intercalators that unbind from DNA per unit time and hence it is indicative of how the off-rate (koff) changes with force. Increasing the force from 12 pN (shadowed in gray) to a higher force value (40 pN, 25 pN) causes a decrease on the slope and hence in koff, whereas decreasing the force to 5 pN causes the opposite effect. We also indicated the measured change in molecular extension (blue lines) when the force is set again at 12 pN after a few minutes at 40 pN, 25 pN and 5 pN, showing that ligands unbind faster as force is decreased.
