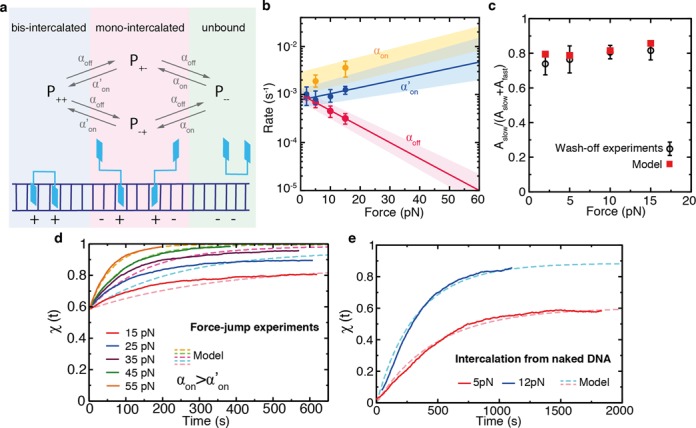
Figure 6.

A kinetic three-state model with microscopic rates  and αoff. (a) Scheme of the kinetic model representing the different accessible states: unbound ligand (green), fully bis-intercalated (blue) and mono-intercalated intermediate (red). The binding of the first intercalating moiety is bimolecular (with a rate αon proportional to ligand concentration), whereas the transition from the mono-intercalated intermediate to a fully bis-intercalated state is unimolecular (with rate
  ). On the other hand, the removal of any of the two intercalative moieties is driven by a single off-rate αoff. (b) Microscopic rates
  , αon and αoff that best describe the experiments. The values of
  (blue points) and αoff (red points) are determined from the macroscopic rates measured in wash-off experiments (Figure 5b). A fit to Equation (7) (red and blue lines) is used to extrapolate the high force values and their associated uncertainty range (shaded area). The rates αon are determined from intercalation experiments with naked DNA (panel (e) and Supplementary Section S5). (c) Ratio of amplitudes of the fast and slow macroscopic off-rates measured in the wash-off experiments (black) compared with the model prediction (red). (d) Fractional elongation of the force-jump experiments from Figure 3a (solid lines) and comparison to the kinetics predicted by the model (dashed lines). (e) Fractional elongation of intercalation experiments (100-nM Thiocoraline) starting from a naked DNA molecule at 5 and 15 pN (solid lines) and comparison to the kinetics predicted by the model (dashed lines).
