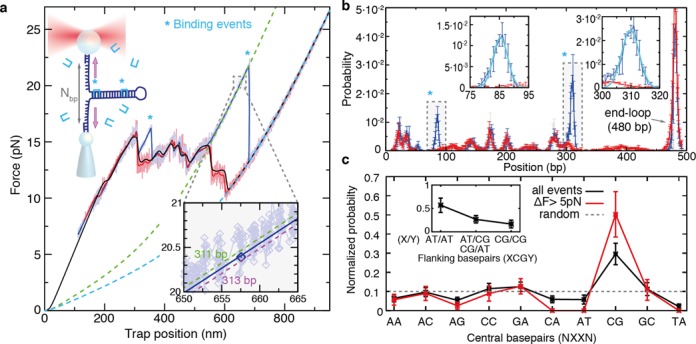
Figure 7.

Single-molecule footprinting reveals preference for CpG steps. (a) DNA unzipping (blue) and rezipping (red) of a 480-bp DNA hairpin in the presence of 5-nM Thiocoraline. Pulling speed is 70 nm/s and data are recorded at 1 kHz (light colors) and filtered to 10 Hz (dark colors). The binding of a ligand brings an extra stabilization energy, causing a force peak in the unzipping curve (*). A theoretical prediction of the equilibrium FDC is shown in black and used for alignment. An FJC curve corresponding to a fully unzipped hairpin (n = 480 bp, cyan dashed) and one that passes close to a binding event (n = 311 bp, green dashed) are plotted as a reference. Inset: for each datapoint of the unzipping/rezipping curves we found the most probable number of open base pairs n, by finding the theoretical curve that passes closest to it. For the highlighted datapoint (blue), the distance is minimized for n = 312 bp (blue line). (b) Histogram of n values of the unzipping curve (blue) and rezipping curve (red) from panel (a). The histograms match each other except for the positions in which there is a binding event (highlighted in gray, *). Insets: zoom of a binding peak and fit to a Gaussian function (cyan). (c) Normalized probability of clamping sites XX: including all binding events (black), or by selecting events with rupture forces 5 pN higher than the average unzipping force (red). The dashed line indicates the distribution expected for a ligand that uniformly binds all sites. Inset: normalized probability of observing A-T bp or C-G bp flanking the preferred binding site XCGY. (N = 142 binding events, 104 unzipping curves and ∼1 binding event per cycle).
