
Figure 4.
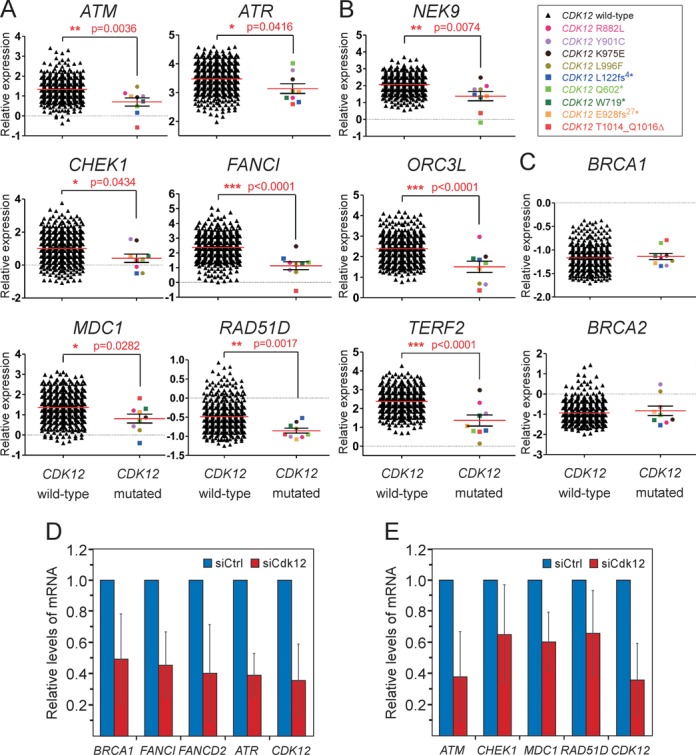
The crucial DDR genes are downregulated in HGS-OvCa patient samples with mutations in CDK12. (A, B and C) Graphs show comparisons of relative expression levels between the HGS-OvCa samples with the wild-type or mutated CDK12. The identity of genes is indicated on top of each graph. The data was generated using the following microarray probes: ATM (212672_at), ATR (209903_s_at), CHEK1 (205394_at), FANCI (213007_at), MDC1 (203062_s_at), RAD51D (209965_s_at), NEK9 (212299_at), ORCL3 (210028_s_at), TERF2 (203611_at), BRCA1 (211851_x_at), BRCA2 (208368_s_at). Whereas samples with the wild-type CDK12 are plotted as black triangles, those containing individual missense or nonsense/indel CDK12 mutations are depicted as colored circles or squares, respectively, as indicated by the legend in the top right corner. Results are presented as mean (red line) with standard error of the mean (SEM) (black whiskers). P-values are given next to red asterisks (*) and the number of asterisks indicates the degree of significance as follows: * = P ≤ 0.05; ** = P ≤ 0.01; *** = P ≤ 0.001. Panels A and C show genes related to the HR pathway, while other affected DDR genes are shown in panel B. (D and E) Depletion of Cdk12 decreases the mRNA levels of HR genes in Caov-3 cells. Relative mRNA levels of genes indicated below the bars were determined by RT-qPCR using total RNA samples isolated from Caov-3 cells treated with the control (blue bars) or Cdk12 #1 siRNA (red bars). The error bars represent the mean ± SD.