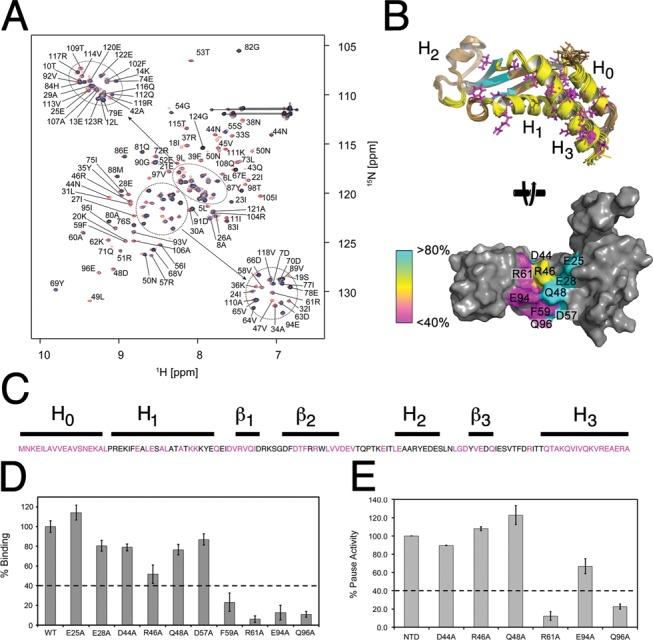
Figure 5.

Identification of the FTH binding site on NusAN. (A) Overlay of 15N HSQC spectra of NusAN in the presence of increasing concentrations of unlabelled β-flap (red = control, blue = 1:0.2 and black = 1:0.4). Lines indicate glutamine or asparagine sidechain NH2 groups. (B) Top: B. subtilis NusAN with residues in more than one conformation shown in magenta, and those affected by binding to the β-flap shown in yellow (helical bundle and core) and cyan (β-sheet domain). Bottom: E. coli NusAN rotated 90° from the top view to show residues involved in interaction with the β-flap. Magenta, yellow and cyan colouring denotes importance from most to least important. (C) Sequence of E. coli NusAN with residues altered for binding/transcription pause assays in magenta. Lines above are labelled corresponding to secondary structure. (D, E) Data for binding of β-flap to NusAN with residue changes at the positions indicated along the x-axis (E. coli NusAN numbering) determined by ELISA (D) and transcription pause assay (E). Binding strength or pause activity is relative to wild-type NusAN (WT, 100%). Results are from triplicate samples ± SD.
