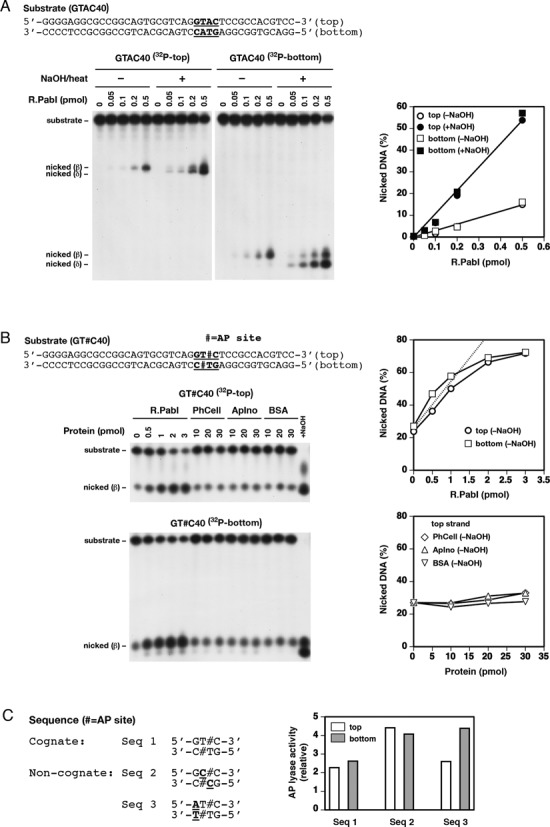
Figure 3.

R.PabI has DNA glycosylase and uncoupled AP lyase activities. (A) DNA glycosylase activity. A 40-mer double-stranded substrate (GTAC40 (Supplementary Table S2), 0.2 pmol, 10 nM) with a 5′-32P label on the top or bottom strand was incubated with R.PabI (0–0.5 pmol, 0–25 nM) at 70°C for 1 h. After incubation, half the reaction mixture was treated with 0.1 M NaOH at 70°C for 10 min to cleave AP sites. Left, samples separated by 18% denaturing PAGE. Right, amount of nicked DNA without (–) or with (+) postreaction NaOH treatment. Plots with +NaOH show DNA glycosylase activity. (B) AP lyase activity. Reactions were performed as in (A) except that the substrate (GT#C40, Supplementary Table S2) contained two AP sites at the indicated positions and no postreaction NaOH treatment was included. The substrate (0.2 pmol, 10 nM) was incubated with R.PabI (0–3 pmol, 0–150 nM), Pyrococcus horikoshii OT3 cellulase (PhCell), Aeropyrum pernix K1 inositol 1-phosphate synthase (ApIno), or BSA (all 0–30 pmol, 0–1500 nM) at 70°C for 1 h. Products were analyzed by 18% denaturing PAGE (gels on the left). The amounts of nicked DNA for top and bottom strands are plotted in graphs on the right. Note that ∼25% of the DNA substrate underwent spontaneous cleavage at AP site without enzyme treatment during reactions. The dotted line in the upper graph for R.PabI is a linear regression of the initial averaged slopes of top and bottom strand cleavage. The lower graph for proteins other than R.PabI shows the data for the top strand cleavage alone for clarity. The result for the bottom strand cleavage was similar to that for the top strand. (C) Sequence specificity of AP lyase activity. Reactions of R.PabI (0–1 pmol, 0–50 nM) were performed as in (B) using 40-mer double-stranded substrates (GT#C40, GC#C40, and AT#C40 (Supplementary Table S2), 0.2 pmol, 10 nM) containing two AP sites in the indicated sequence contexts (Seq 1–3). The activities for AP sites in Seq 1–3 were determined from the relationship between the amounts of R.PabI and nicked products (after subtraction of spontaneous cleavage) and the relative activities are plotted against Seq 1–3 in the graph. All graph data in (A)–(C) are the average of two independent experiments.
