
Figure 3.
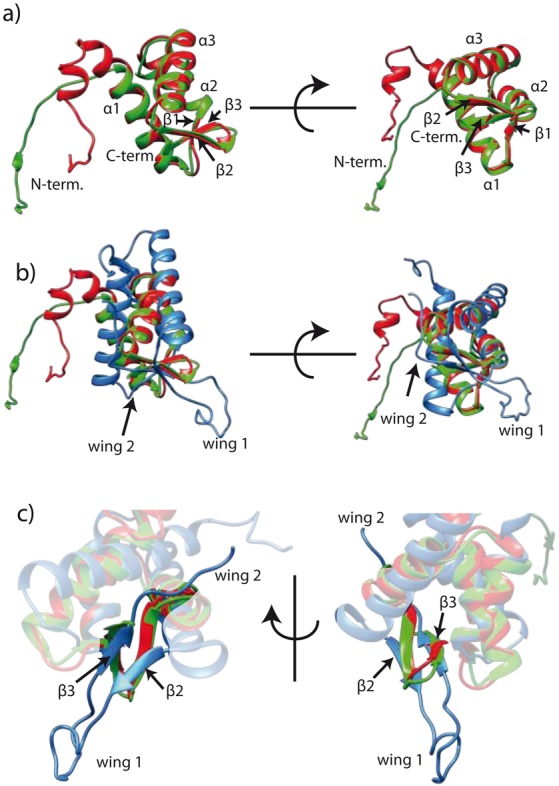
(a) Superimposition of Sso (red) and Mth (green) MCM C-terminal domains. (b) Superimposition of human MCM6 (blue, PDB: 2KLQ) and archaeal MCM (color code as in a)) C-terminal regions. (c) The human MCM6 WH domain shows extended loop regions (wing 1 and 2) which are truncated in the archaeal counterparts. Shown are mean structures derived from NMR structure ensembles. α1-3: α helix 1-3; β1-3: β strand 1-3.