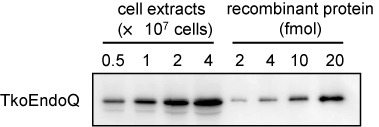
Figure 8.

Estimation of the amount of TkoEndoQ in T. kodakarensis cells. The T. kodakarensis cells at exponential phases were harvested, and the whole cell extracts from the indicated numbers of the cells were subjected to western blot analysis. To create a standard curve, the serially diluted recombinant TkoEndoQ protein was subjected to the western blot analysis in parallel, and the band intensities were quantified by an image analyzer.
