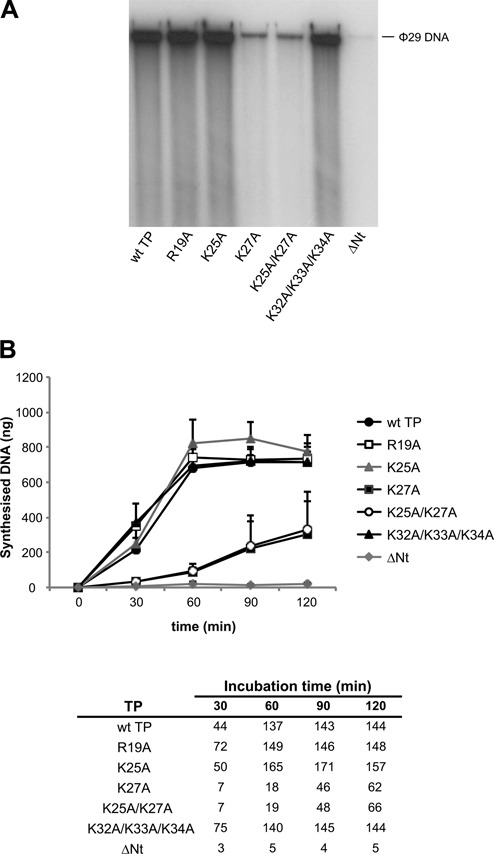
Figure 6.

ϕ29 TP-DNA amplification with wild-type and N-terminal mutant TPs. The amplification assay was carried out as described in Materials and Methods with 6 nM of TP and 6 nM of DNA polymerase using 16 pM of TP-DNA as template. (A) ϕ29 TP-DNA amplification reactions after 60 min of incubation at 30°C. The position of unit length ϕ29 DNA is indicated. The figure is representative of three independent experiments. (B) Kinetics of the synthesised DNA (in ng) at the indicated times of incubation. Data are represented as mean and standard deviation derived from three independent experiments. In the table, numbers show the amplification factors calculated as the ratio between the amount of DNA in ng at the end of the reaction (input DNA plus synthesised DNA) and the amount of input DNA.
