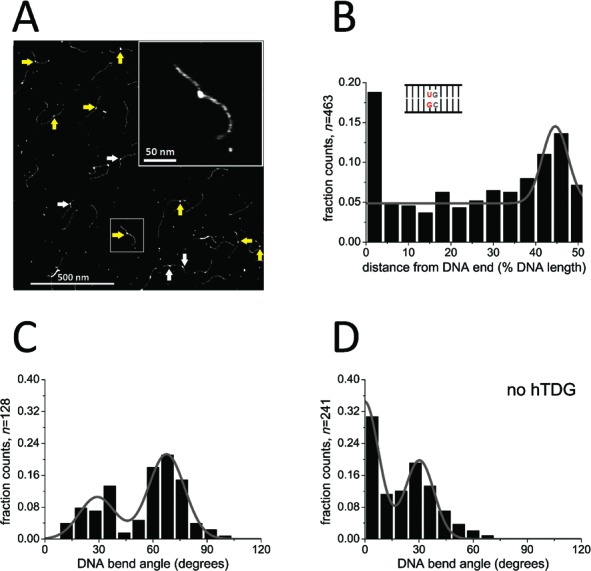
Figure 1.

Specific complexes of hTDG at G:U lesion sites. (A) AFM image of the catalytically inactive hTDG variant N140A on DNA substrate containing a G:U mismatch positioned at 46% of the DNA fragment length. Arrows point to specific TDG complexes bound at the target site (yellow) and nonspecific complexes bound elsewhere on homoduplex DNA (white). The insert shows a higher magnification of a representative (specific) hTDG–DNA complex. (B) TDG binding position distribution on DNA demonstrating a moderate binding preference for the G:U mismatch over nonspecific DNA (enhanced occupancy at ∼46% DNA length). Fractional occupancies are plotted for ∼22 bp long sections of the 549 bp DNA substrate from DNA fragment ends (0%) to DNA center (50%). (C) Distribution of DNA bend angles induced by hTDG-N140A at G:U sites. A double Gaussian fit (R2 = 0.88) centered at (29 ± 10) and (68 ± 10)°. Bend angles are binned at intervals of 8 bp. (D) Distribution of intrinsic DNA bend angles at the G:U mismatch in the absence of protein revealed a similar DNA bend angle of (30 ± 8)° as in (C) in addition to a predominant straight DNA conformation (0 ± 8)°. Results were pooled from three individual experiments (n = total number of data points) and are summarized in Table 3.
