Figure 2.

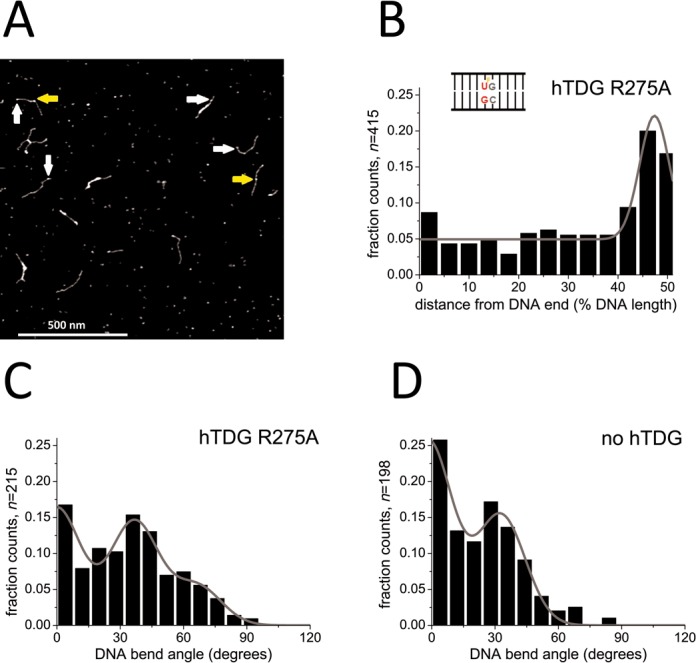
Specific complexes of hTDG-R275A at G:UF lesion sites. (A) AFM image of hTDG-R275A on DNA substrate containing a G:UF mismatch at 46% of DNA fragment length. Arrows point to specific hTDG-R275A–DNA complexes bound to the target site (yellow) and nonspecific complexes (white). (B) A Gaussian fit to the hTDG-R275A binding position distributions on G:UF DNA revealed a lesion specificity of S = (358 ± 101). (C) Distribution of DNA bend angles induced by hTDG-R275A at G:UF sites. A triple Gaussian fit (R2 = 0.89) centered at (0 ± 12), (37 ± 12) and (66 ± 12)°. (D) Distribution of intrinsic DNA bend angles at the G:UF mismatch in the absence of protein revealed a similar slightly bent state (33 ± 12)° as in (C) and a predominant linear state (2 ± 12)°. Results were pooled from three individual experiments (n = total data points) and are summarized in Table 3.
