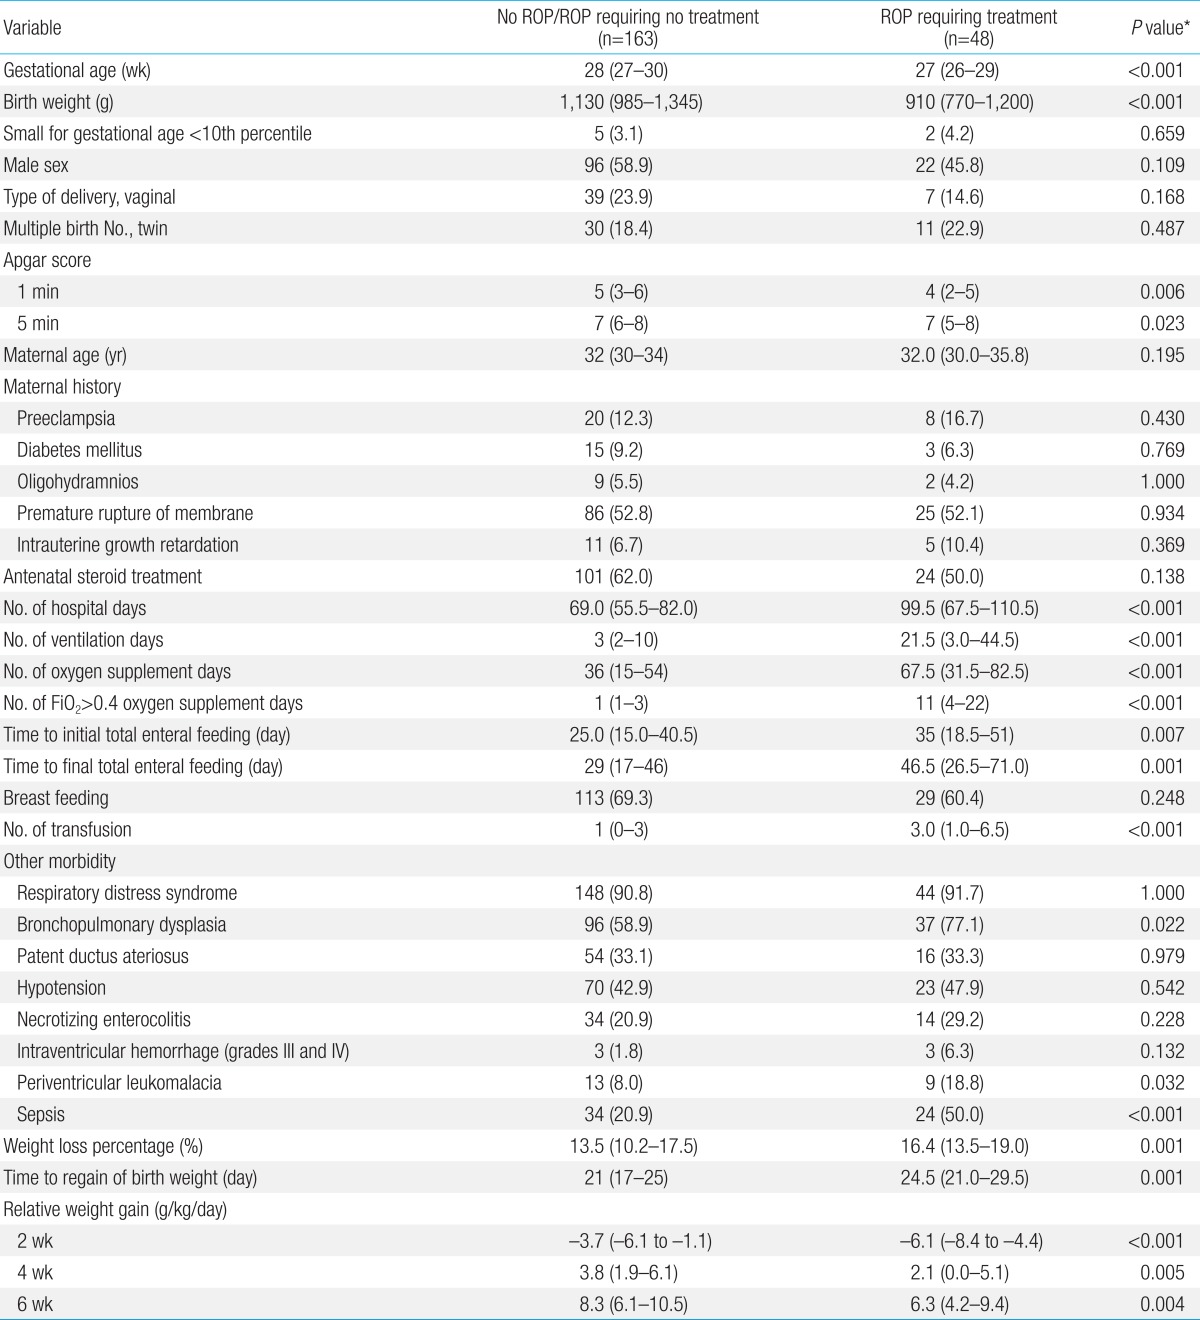
Table 2. Univariate analysis of risk factors between no ROP/ROP requiring no treatment and ROP requiring treatment group.

Values are presented as median (interquartile range) or number (%).
ROP, retinopathy of prematurity; FiO2, fraction of inspired oxygen.
*Mann-Whitney U test was used for continuous variables and chi-square or Fisher exact tests were used for categorical variables.
