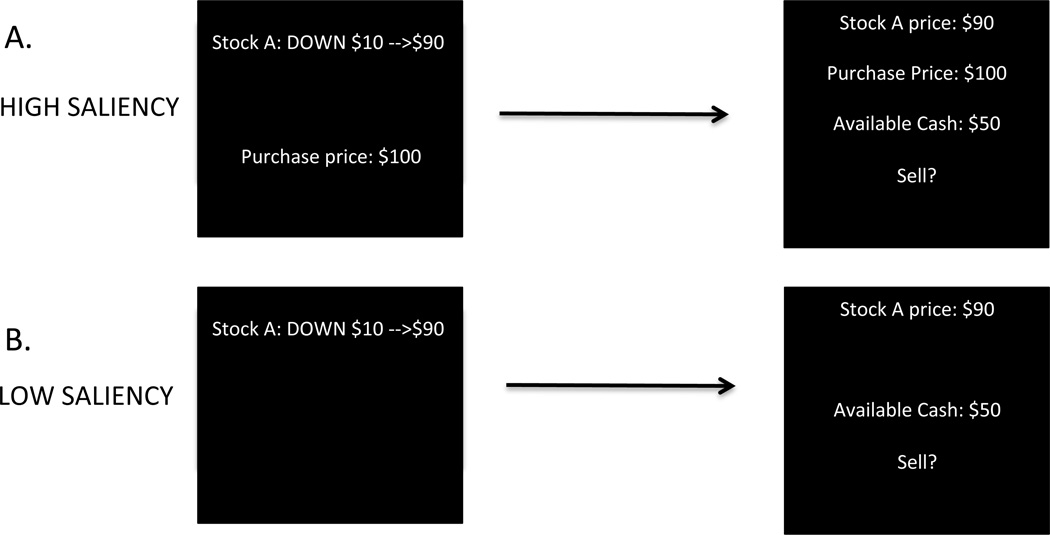
Figure 1. Sample screens from the two experimental conditions.
Each trial in every condition consists of a “price update” screen (2 seconds), followed by a 1 second inter-trial interval, then followed by a “trading” screen (3 seconds). A) HIGH-SALIENCY condition, during which current and purchase price information are displayed on both screens. B) LOW-SALIENCY condition, in which the purchase price is removed from both screens.

