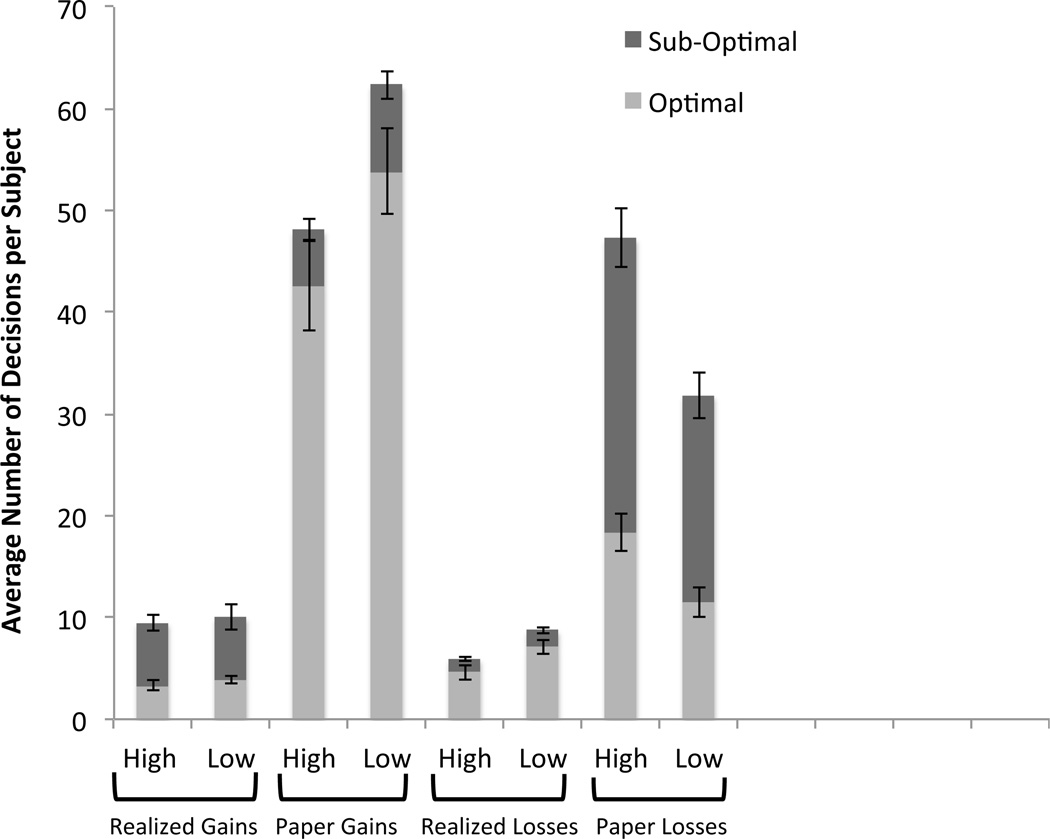
Figure 3. Selling behavior disaggregated by decision type.
Data are binned according to whether the decision was optimal or sub-optimal, and whether it was generated from the HIGH-SALIENCY or LOW-SALIENCY condition. Realized gains and realized losses are optimal when the REV is positive, whereas paper gains and paper losses are optimal when the REV is negative. The chart shows that the LOW-SALIENCY treatment primarily affects behavior through the paper loss and paper gain channels; that is, the disposition effect is attenuated because of a reduction in paper losses and an increase in paper gains. Bars depict 95% confidence intervals of the sample mean across subjects, computed separately for each category.

