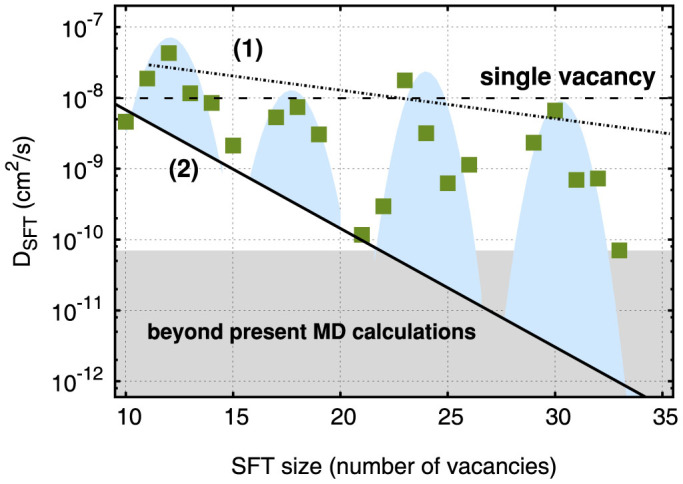
Figure 3. Diffusion coefficient at 700 K of several SFT configuration depending on the number of vacancies composing the defect.

The green dots show the MD results and the light blue shade is a fit to the data. The maximum diffusivity of defective SFTs (1) and the minimum diffusivity of perfect SFTs (2) have also been fitted. The diffusivity of a single vacancy is also shown for comparison.
