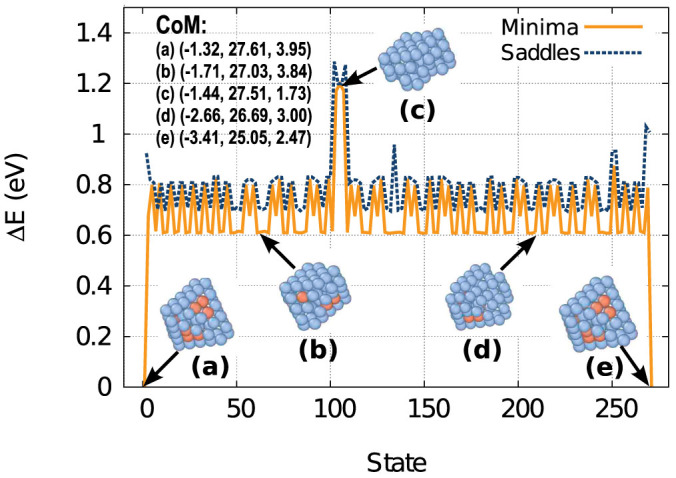
Figure 6. Pathway for the net translation of the CoM of a perfect 10-V SFT as identified from TAD simulations.

Only unique states are shown. Both the energies of the minima (solid line) and the saddles (dashed line) relative to the perfect SFT structure at state 0 are indicated. The coordinates of the CoM of each structure in Å are also shown.
