FIG 1.

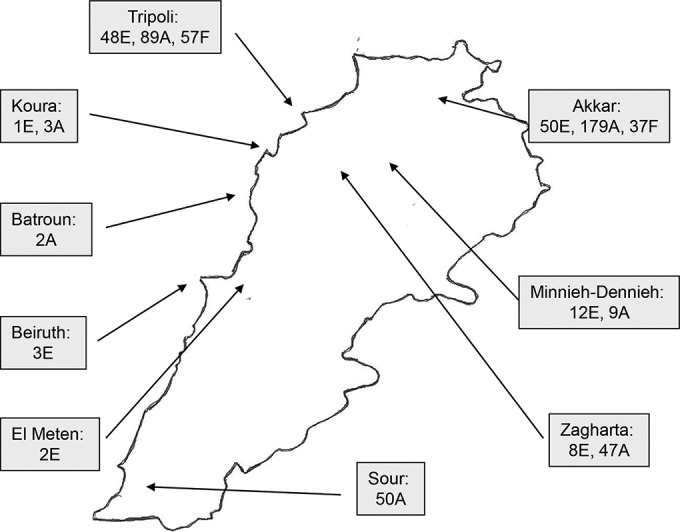
Map of Lebanon showing the distribution of epidemiological samples between districts. E, environmental samples (soil and water); A, animal samples; F, food samples (meat, milk, and cheese).

Map of Lebanon showing the distribution of epidemiological samples between districts. E, environmental samples (soil and water); A, animal samples; F, food samples (meat, milk, and cheese).