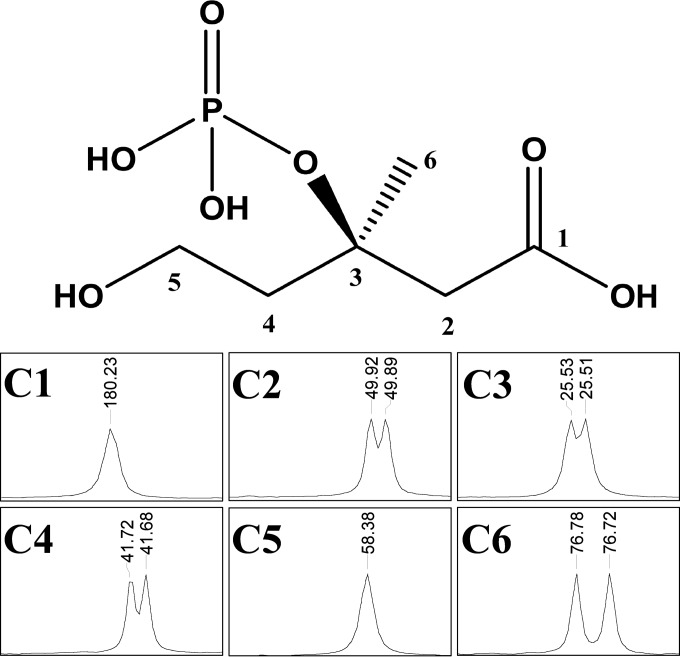
FIG 5.
NMR analysis. The full spectrum is available in the supplemental material (see Fig. S6 in the supplemental material). The MVA-3P structure is shown at the top, and the peaks corresponding to carbons 1 to 6 are shown at the bottom. Values are in parts per million (ppm). The reaction was performed as previously described (31) using MVA as the substrate at a concentration of 40 mM. Samples were analyzed after 24 h.

