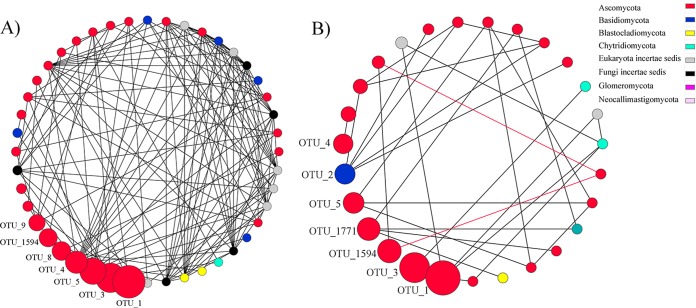
FIG 4.
The subnetwork of top seven most abundant OTU and their first neighbor nodes in the aCO2 (A) and eCO2 (B) networks. Each node represents an OTU, which would be regarded as a fungal species. The size of nodes represents relative abundance of OTU. Each link connects two OTU. Gray links mean positive connections, and red links indicate negative connections. Different colors refer to different fungal phyla. The OTU with top relative abundances are marked with OTU identification numbers.

