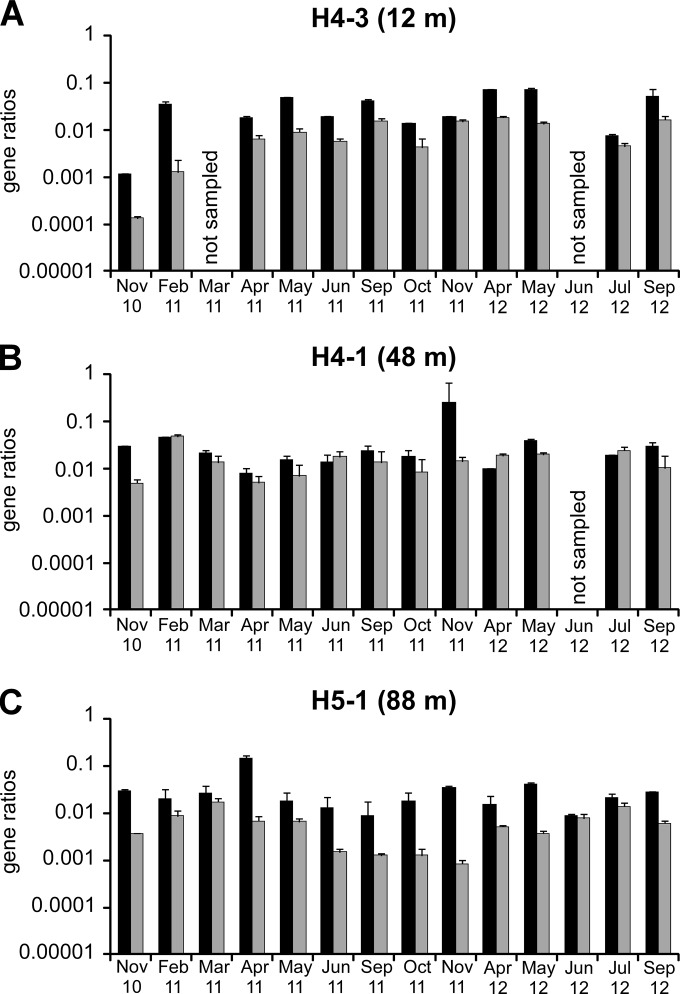
FIG 5.
Relative numbers of cbbM (black) and cbbL (gray) genes compared to bacterial and archaeal 16S rRNA gene numbers over a 2-year period. (A) Site H4-3 (upper aquifer; 12-m depth); (B) site H4-1 (lower aquifer; 48-m depth); (C) site H5-1 (lower aquifer; 88-m depth). Error bars represent the standard deviations of data from three replicate qPCRs.

