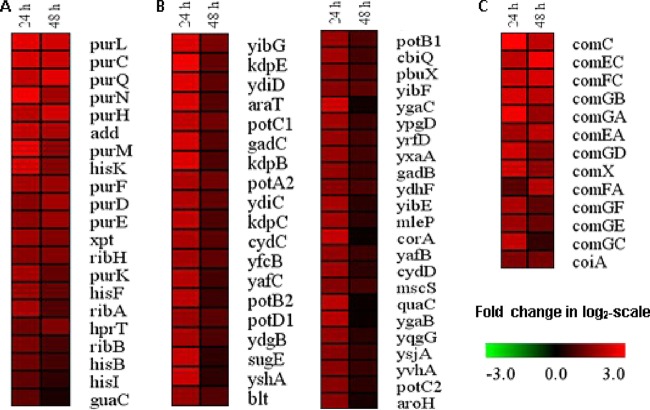
FIG 3.
Heat map of L. lactis KF147 genes differentially expressed (log2 scale; P ≤ 0.05) during medium starvation (24 h) and a recovery period in retentostat cultivation (48 h) compared to the initial retentostat culture (0 h) that are clustered in model profiles 6 and 7 by the STEM module. Genes are grouped into statistically significant GO categories: (A) purine metabolic process, (B) membrane and transmembrane transporter activity, and (C) competence protein-related genes. In all panels, the genes are ordered on the basis of their expression changes from the highest to the lowest level. Gene expression patterns shown are derived from one of the experimental duplicates, and these expression patterns were highly similar between duplicates.

