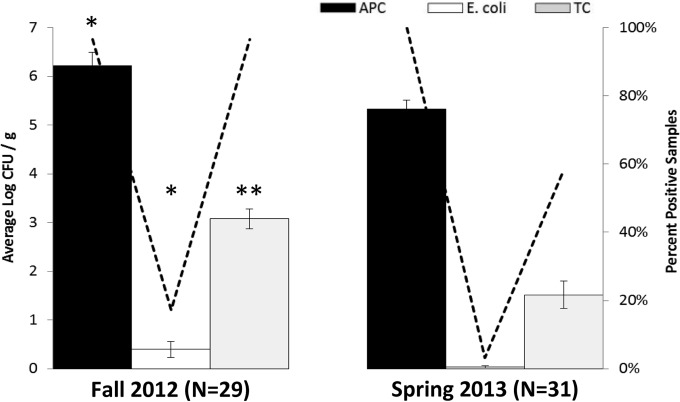
FIG 3.
Average indicator bacterial counts (log CFU/g) (bars) and percentages of positive samples (lines) for field soil by growing season. Field soil samples consisted of mixed surface and subsurface layers. The dashed line indicates the percentage of positive samples for aerobic mesophilic bacteria (APC), generic E. coli, and total coliforms (TC). Growing season (fall 2012 versus spring 2013) was a significant factor (P < 0.05) for all indicator bacteria; asterisks indicate degree of significance (*, P < 0.05; **, P < 0.001) for a given indicator organism between the two growing seasons. Data were log transformed prior to statistical analysis. Standard error bars shown.

