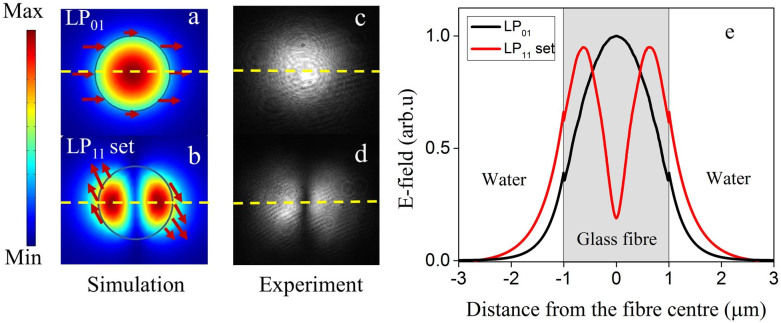
Figure 3. Field distribution of LP01 and the LP11 mode set.
(a, b) Numerical mode profiles of the LP01 and total E-field distribution of four modes (TE01 and TM01, HE21,e, HE21,o) in the LP11 set, (c, d) experimental beam profiles of the fundamental LP01 and the higher order LP11 modes, respectively. The horizontal dashed lines represent the orientation of maximum intensity (e) E-field distribution of the LP01 and LP11 mode set of a 2 μm microfibre along the direction indicated by the dashed line in (a) and (b).

