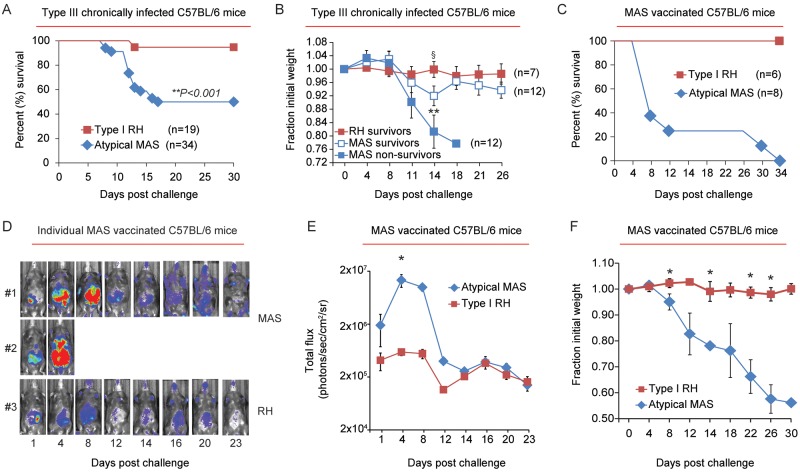
FIG 1 .
Compromised host immunity to the atypical T. gondii strain MAS. (A) C57BL/6 mice were infected (i.p.) with an avirulent type III strain (CEP) and allowed to progress to chronic infection. Thirty-five to 70 days later, mice were challenged (i.p.) with 5 × 10⁴ tachyzoites of either the atypical MAS or type I RH strains. Results were compiled from 6 to 8 independent experiments, and the percent survival following challenge is plotted for each strain. The number of mice in each group (n) is indicated; **, P value was calculated by a log-rank Mantel-Cox test and was considered significant. (B) The average relative weights ± SEM of mice that did not survive secondary infection with the MAS strain and of those that survived RH and MAS secondary infections are shown; for each measured time point, the fraction of initial weight at the time of challenge (day zero weight = 1) were plotted. Results are cumulative from 5 independent experiments, and the number of mice (n) in each group is indicated. **, P < 0.009; significant by analysis of variance testing; §, P < 0.04 based on two-tailed Student’s t test, comparing the relative weights between survivors of type I RH and MAS secondary challenges. (C) Cumulative survival, combined from 2 experiments, in which C57BL/6 mice were vaccinated with the atypical strain MAS and challenged with either the MAS-Luc or type I RH-Luc strain; the number (n) of mice in each group is indicated and all mice were seropositive prior to challenge (see Materials and Methods). In the absence of vaccination, MAS-infected and type I RH-infected mice died between days 5 and 8 postinjection (data not shown). (D) Representative bioluminescence imaging of 2 individual mice challenged with the MAS-Luc strain and 1 mouse challenged with the RH-Luc strain (from the experiments described for panel C). The relative parasite burden is depicted as a heat map: maximum = 105, minimum = 3 × 10³ (photons/s/cm2/sr). MAS-challenged mouse 1 was euthanized on day 27 because it had a poor body condition score (BC, 2−) and was continuing to lose weight; MAS-challenged mouse 2 died on day 5. (E) Average luciferase activity (in photons/s/cm/sr2, ± SEM) for each cohort following challenge with the type I RH-Luc (n = 3) or MAS-Luc (n = 4) strains. Data shown are from a single experiment representative of two experiments. *, P < 0.05 (Student’s t test). (F) Results obtained from the same experiment described in panel C, but the average fraction of initial weight (± SEM) of mice following secondary infection with the MAS and RH strains is shown. *, P < 0.05 (Student’s t test).

