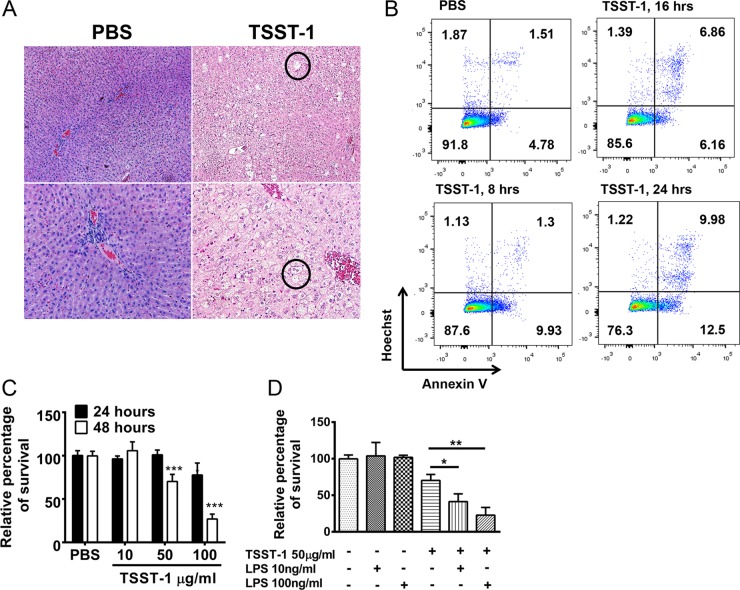
FIG 3 .
TSST-1 induces liver damage. (A) Hematoxylin-and-eosin (H&E)-stained livers from TSST-1- and PBS-treated rabbits after 6 weeks of treatment. Circles indicate areas of microvesicle formation. (B) Frequencies of HepG2 cells labeled with annexin V antibody after treatment with TSST-1 (100 µg/ml) or PBS at various time points. (C) Percentages of HepG2 cells surviving after 24 and 48 h of treatment with TSST-1 (100, 50, and 10 µg/ml) or PBS. (D) Percentages of HepG2 cells surviving after 48 h of treatment with TSST-1 (50 µg/ml) alone, LPS (endotoxin; 10 and 100 ng/ml) alone, or TSST-1 and LPS together. Statistically significant differences were analyzed by Student’s t test (*, P < 0.05; **, P < 0.01; ***, P < 0.001). Error bars show standard deviations.

