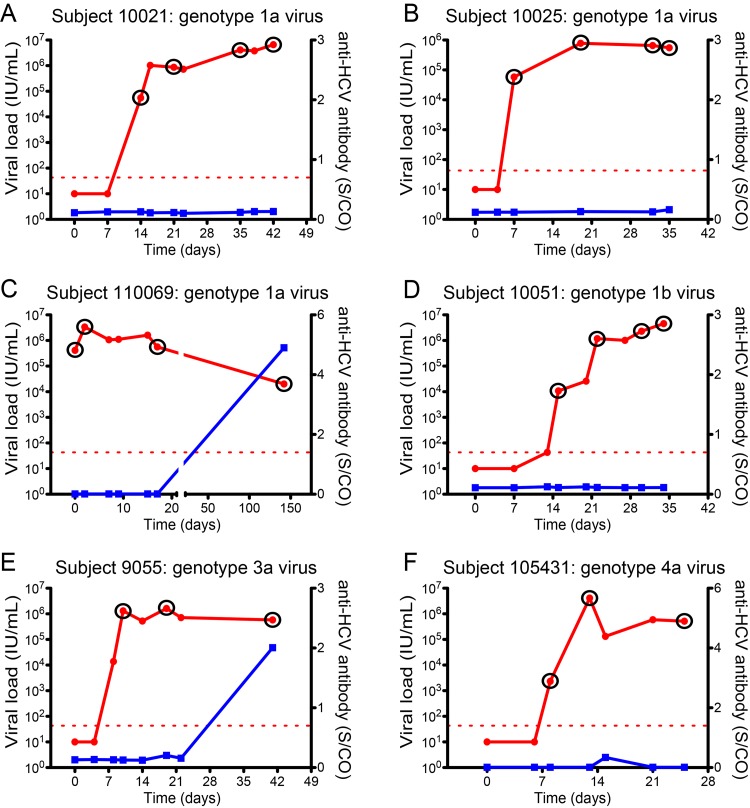
FIG 1 .
Plasma viral RNA and anti-HCV antibody kinetics in acutely infected subjects. Kinetics of viral RNA (red line) and anti-HCV antibody (blue line) are depicted. The red dashed line is the lower limit of sensitivity of the viral RNA assay. S/CO denotes the signal to cutoff ratio. Circled time points are samples that were used to generate full or partial genomes for genetic analysis and molecular clone construction.

