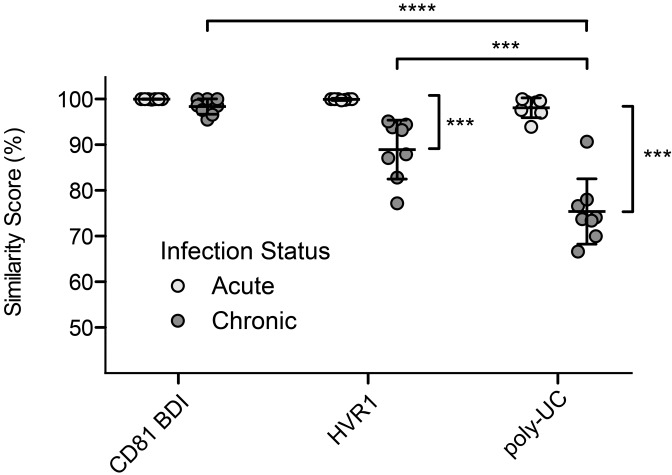
FIG 4 .
Nucleotide sequence similarity scores of the poly(UC) tract, Env E2 hypervariable region and CD81 binding domain I in acute and chronic infection. The y axis denotes the mean percent similarity score from Needleman-Wunsch pairwise analysis of genomic regions corresponding to the CD81 binding domain I (AF009606 positions 1491 to 1530), the E2 hypervariable region (AF009606 positions 1575 to 1614), and a 45-nucleotide portion of the poly(U/UC) tract immediately 5' of the X-tail (AF009606 positions 9504 to 9548). Means and standard deviations are indicated (***, P < 0.001; ****, P < 0.0001).

